
Related pages
About this page
For those deep into statistics, these are four papers from reviewed literature.
- Global Warming Is Driven by Anthropogenic Emissions: A Time Series Analysis Approach
- Scaling fluctuation analysis and statistical hypothesis 7 testing of anthropogenic warming
- Dependence of global temperatures on atmospheric CO2 and solar irradiance
- On the causal structure between CO2 and global temperature
These all show that the probability that increases in CO2 are the cause of climate change is extremely high - > 1000 to one.
A simpler, more easily understandable example of the use of statistics in studying climate change has been given in an American Statistical Society publication.
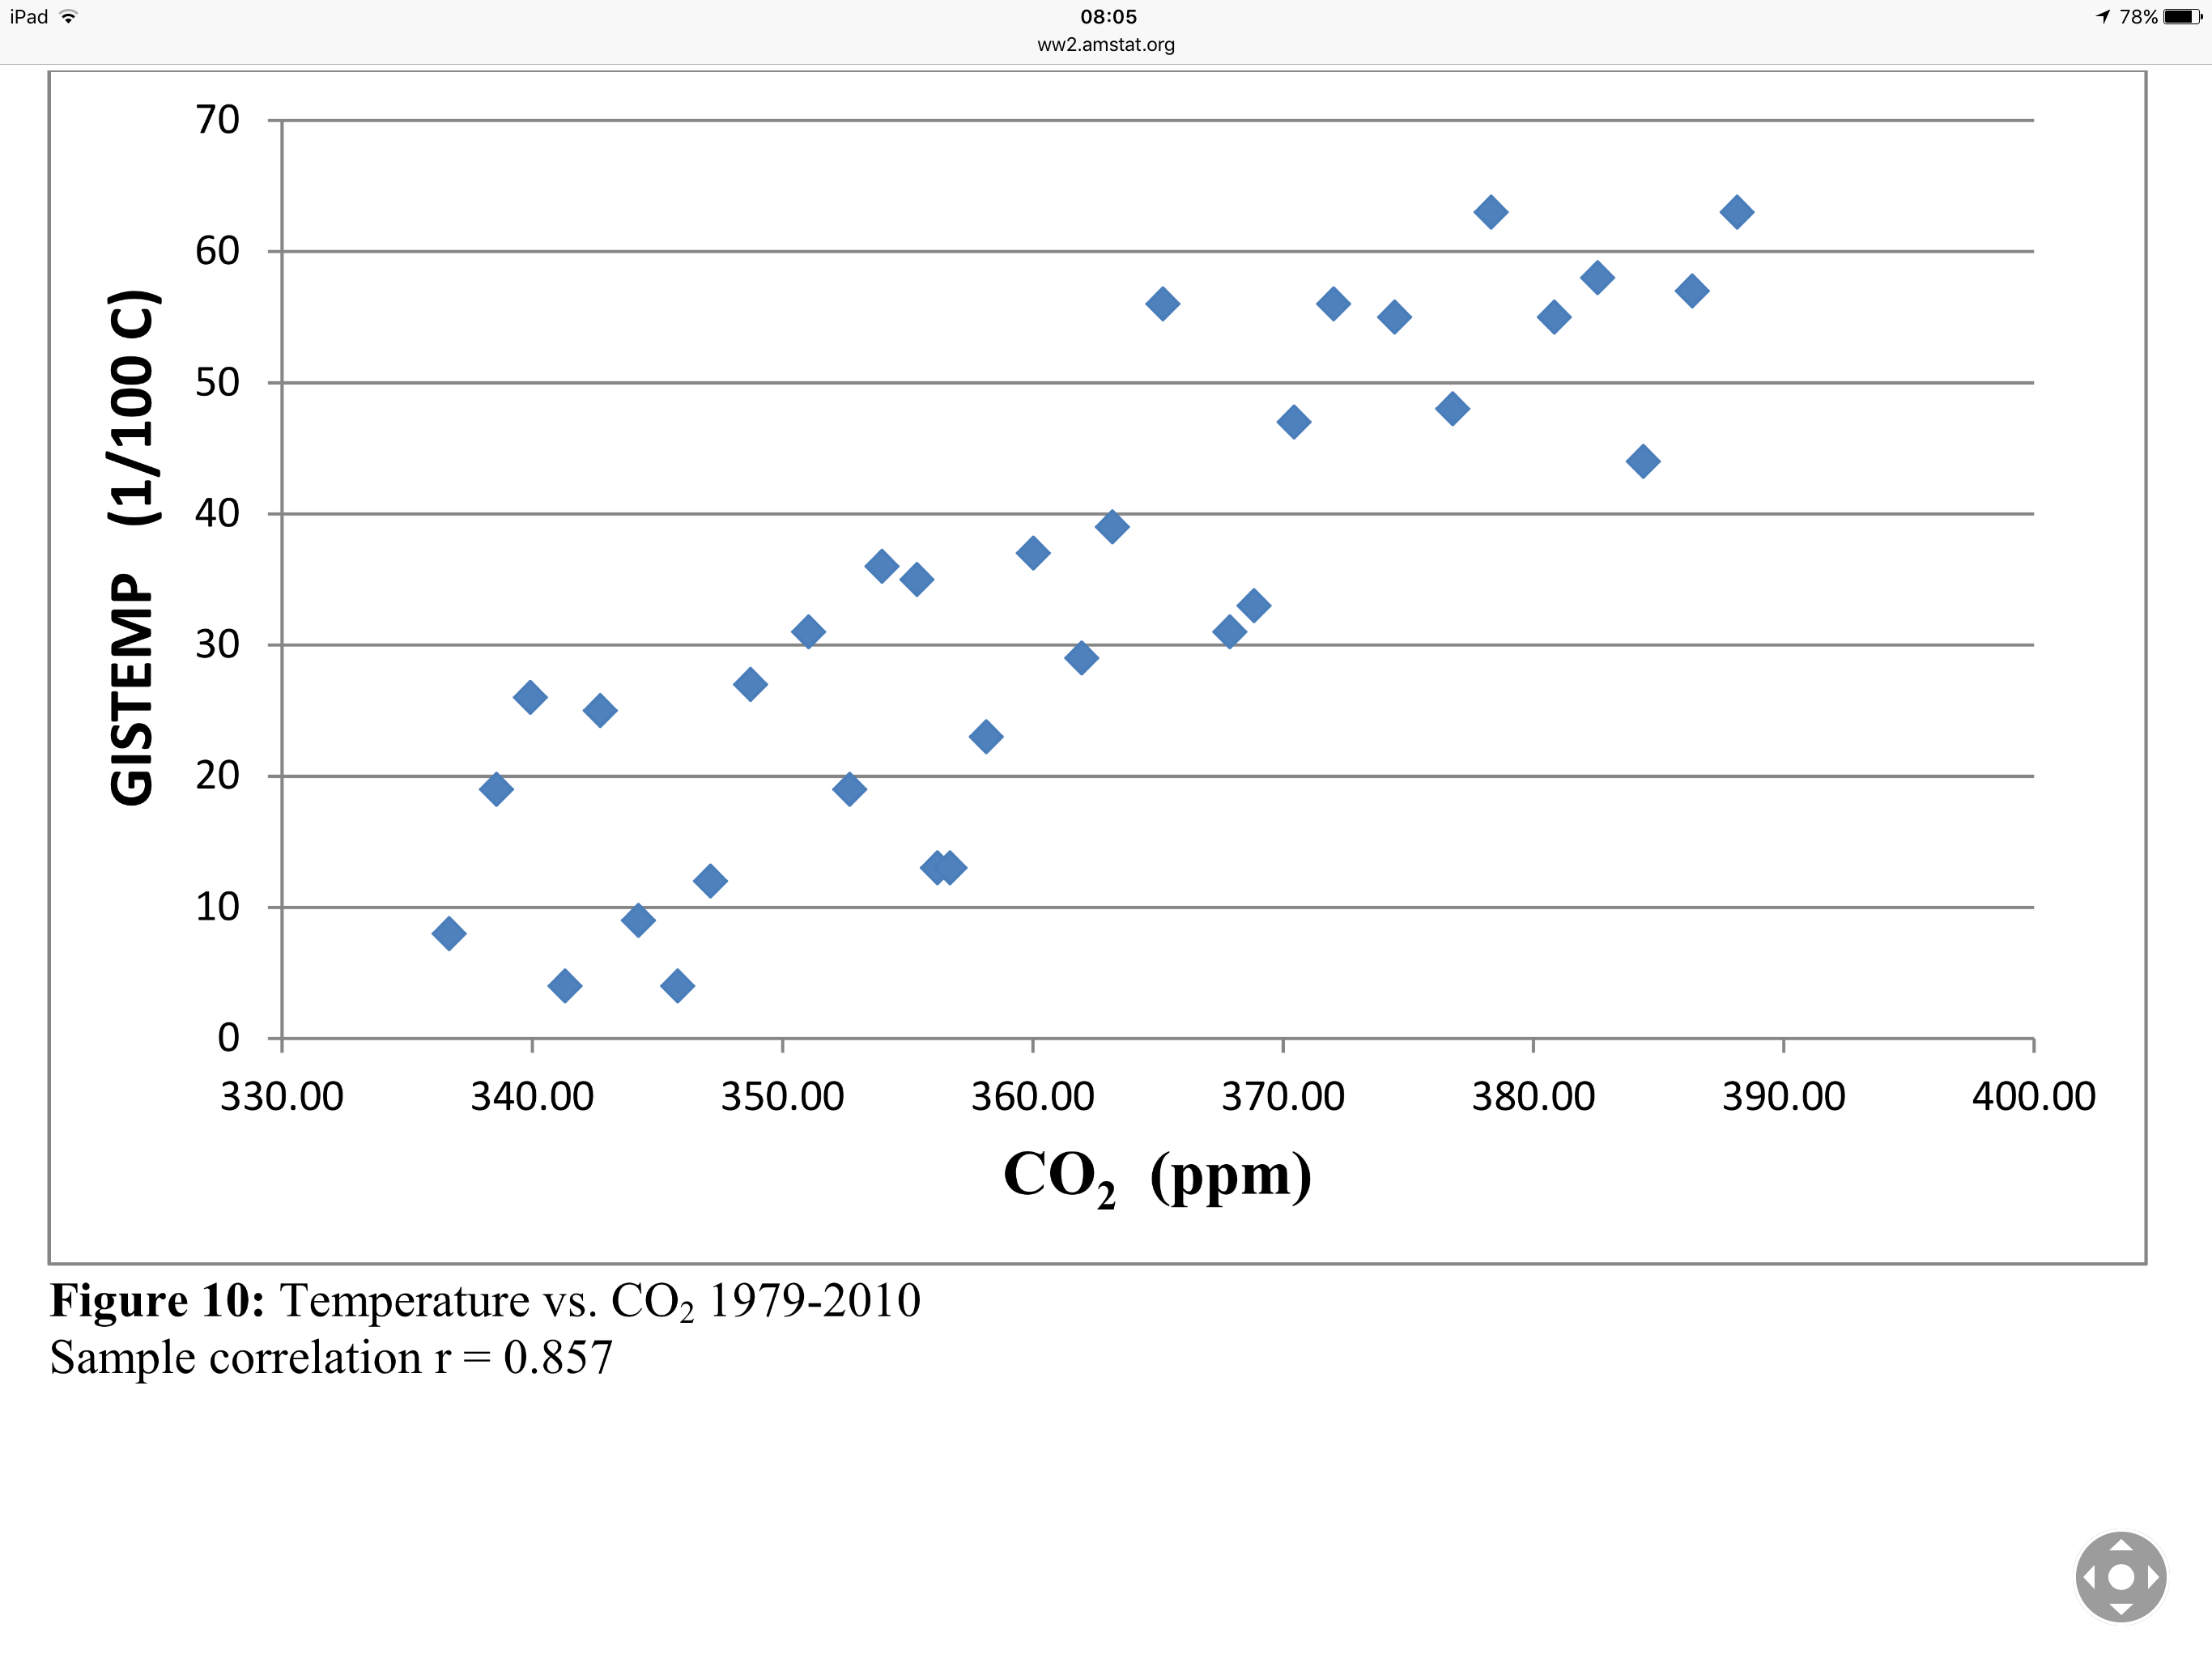
Those with a knowledge of statistics will know that correlation coefficient of 0.857 from a sample population of 32 pairs of data is highly significant.
A recent (July 2019) paper in the journal Nature is
A more readable summary version of this paper is in
This shows that events such as the Mediaeval Warm Period and Little Ice Age were regional rather than global events. Also, that the current rise in temperature is unlikely to be a natural event.
Methane
Associated with CO2 we have CH4. Increases in the former encourage vegetable and animal life with consequent increases in the latter. The next diagram shows how the two have changed over the past 1000 years.

This shows how increases in the two are related. Although amounts of CH4 are far, less the CO2 the absorption is dissed proportionately greater - as is that of CO2 relative to H2O.
Conclusions
Statistical analyses, in themselves, prove nothing, In the case pf climate change, they provide confirmation that there is no other mechanism by which heat input to the atmosphere can increase over timescales of a 100 or so years. The real proof about climate change, in case of any doubt, is the understanding of the basic physics.
There are still doubters and deniers who claim that global warming since the industrial revolution is due to natural effects. Quite simply, they are wrong.