
Latest revision 15th September 2019.
About this page
Climate change is a subject that generates a great deal of heat often with little light. There is much emotion often conflated with politics. I see much confusion in the the general perception if not within the climate science community.
On this page
Introduction
Some history
The Questions
Why does climate change?
Is it really getting warmer?
Are greenhouse gases really the cause?
Is man responsible?
Models and what they show
Improving models
Climate Scenarios
What should we do?
Climate myths
Appendices
This is my latest revision of a page written, originally, in 2004. I have tried to make it more succinct than the original although that is difficult with such a complex, wide-ranging topic. I hope that short, clearly headed sections will help the reader.
Unsurprisingly, I find Donald Trump’s actions on climate to be worrying. His reported statement that it is all a “hoax invented by the Chinese,” is just incorrect and unworthy of a clever man.
Introduction
Climate is changing. Given the potential dangers and the perceived costs of taking or not taking action, it is not surprising that there are widely disparate views among the general, non-specialist public and some politicians. At one extreme we have the doom-mongers who predict the end of the world as we know it. At the other extreme are the deniers who seem to be incapable of accepting the reality of climate change let alone why it is changing. Then we have those that accept what has happened as fact but are reluctant to go further and agree that there may be real dangers. Sometimes known as “luke warmers”, in effect, they are closet deniers.
Talking to climate scientists and reading peer reviewed papers, it is clear that none of these positions is correct or sensible. I have a wide-ranging meteorological background but am not an expert in the subject. I have tried to write this page as a “plain man’s guide.”
Some history
It has been known since the late 19th century that CO2 can absorb infrared radiation but it was not until the 1970s that satellites started to measure the absorption globally and continuously. It was also in the 1970s that radiative transfer was incorporated into Numerical Weather Prediction (NWP) models.
One of the criticisms of climate scientists relates to the suggestion of a “nuclear winter.” The idea being that increasing dust from industry and domestic fossil fuel burning would cool the atmosphere. The first Gulf war with destruction of oil wells creating vast dust clouds heightened that idea. The possibility is still real despite significant reductions in anthropogenic aerosol production. One of the known unknowns is the extent of future volcanic eruptions. We know, from temperature observations after major eruptions back to Krakatoa in 1883, that volcanic dust has a measurable cooling effect lasting several years. Although highly unlikely, a period of intense eruptions could still give us a “nuclear winter.”
The Questions
Is climate changing? The answer must always be "Yes". Climate has always been changing. But, the important questions are:
- Are the current changes really unusual?"
- Why is it changing?
- Is man responsible?"
- And, if so can or should any action be taken?
Why climate changes
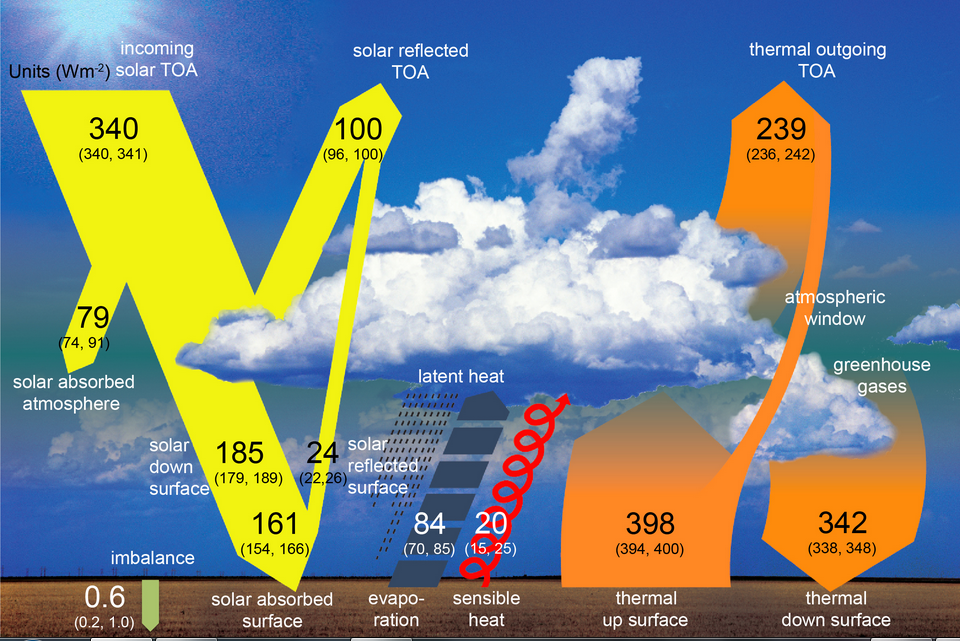
On my NWP page I describe briefly how the atmosphere works. As will be seen from that page and this diagram it is a complex system driven by heat from the sun as the only external source of energy to the climate system.
Two factors determine the heat input to the atmosphere. The first is how heat from the sun is geographically distributed relative to the major land masses. The second is how that heat is converted into air movement that we experience as the weather and climate system.
Geographical distribution of heat from the sun
Over periods of many thousands of years, changes in the earth’s orbit around the sun have led to Ice ages and Inter-Glacial Periods. Three factors come into play.
- The elliptical path of the earth around the sun is slowly changing.
- The tilt of the earth’s axis to the plane of the orbit is changing.
* “Wobbles” in the tilt of the axis. The fastest of these, and with the smallest effect, is the “wobble” with a period of around 45,000 years.
The Northern Hemisphere's last ice age ended about 20,000 years ago, and it has been generally assumed that the ice age in the Southern Hemisphere ended about 2,000 years later although recent evidence suggests that that Antarctic warming may have begun 4000 years earlier than previously thought.
In the context of what has happened over the past 100 or even 1000 years, these orbital variations are too slow to have a measurable effect.
Over long periods the emission of heat by the sun is virtually constant. There are cyclic changes in the amount of heat emitted by the sun – the quasi 11-year sunspot cycle is the best known. The effects of this are fairly small and swamped by other effects. In any case, being cyclic, they do not create long term change.
How heat drives the atmosphere
The atmosphere is transparent to short wave radiation – mainly at wave lengths of visible light and UV resulting from the sun being well over 6000 degC. The earth absorbs that heat and, much cooler at about 15 degC on average, radiates in the infrared. The outgoing infrared radiation is absorbed and re-emitted by greenhouse gases, primarily water vapour (H2O), carbon dioxide (CO2), methane (CH4), various industrial gases such as nitrogen dioxide (N2O), halocarbons (CFCs) and ozone (O3). Infrared radiation is also absorbed and emitted by cloud and aerosols. The latter come naturally from volcanoes, from dry land and outer space. Man inputs aerosols from industry and other activities such as agriculture and deforestation. Overall, aerosols have a net cooling effect. Cloud is more complex and effects depend on the type of cloud, its height and thickness.
There are many feedbacks; examples are -
- Warmer air can hold more water vapour, a powerful greenhouse gas, so increasing absorption of IR.
- Warmer air melts polar ice resulting in less heat being reflected back out to space during the north or south polar summer.
- Less polar ice means that darker water will lead to more absorption of incoming solar radiation.
- Warmer air can hold more water vapour leading to more cloud increasing reflection back out to space of incoming solar radiation.
- Drier weather can cause desertification leading to more reflection of incoming short wave radiation.
- Wetter weather leads to more vegetation and less reflection. Both processes affect the carbon cycle.
- Etc etc
All the processes can, in principle be calculated using the same computer models that predict daily weather. These are not used to predict specific weather even on yearly scales. They are used to generate a model climatology.
To understand the carbon cycle, see the BBC or the Vision Learning pages.
Is it really getting warmer?
Analysis of tree ring data for Northern Europe undertaken at the Johannes Gutenberg University, Mainz shows a slight decrease in temperature over the period 0-2000 CE. This is shown in this diagram. This shows the fairly small variations during various warm and cold periods.

(Source - https://www.uni-mainz.de/eng/15491.php )
However, since the early 20th century, the climate has been becoming warmer. There has been much argument about the validity of data in the early days of instrumental measurements. I will not address those issues here directly but will just point out that at least 5 separate organisations have produced broadly similar results for global average temperature changes over the past 100+ years. These are the UK Met Office, the Japanese Meteorological Agency, the Goddard Institute for Space Studies, the US National Climate Data Center and Berkeley Earth.
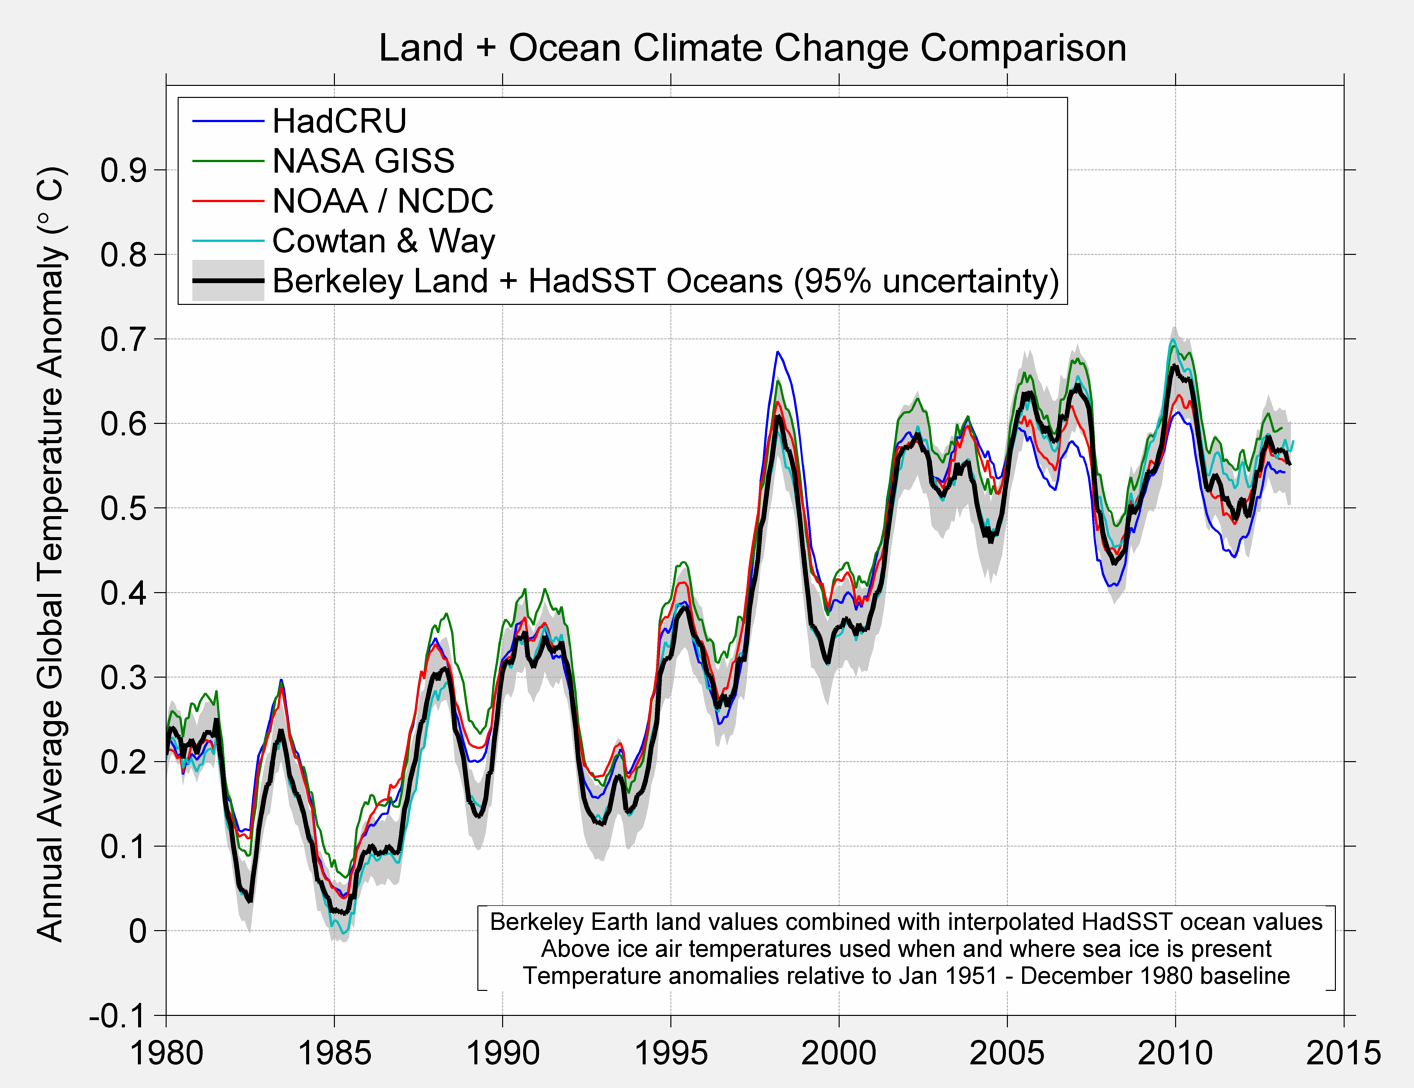
(Source - http://berkeleyearth.org/land-and-ocean-data/ )
The Cowtan and Way data are the UK HadCRU data adjusted for geographical biases in the data. JMA data can be seen on the Climate Data page.
The great variability in the graph of average global temperature is a consequence of the complexity of the global climate system. Phenomena such as El Nino, La Nina are internal to the climate system driven by heating from the sun. They cannot drive long term climate change although they are important over periods of a few years,
It has to be remembered that some 90% of the heat in the system is contained in the oceans compared to about 3% in the atmosphere. The remaining heat is contained in the land and the polar regions. The marked and obvious variations in air temperature are, in fact, rather trivial noise in a global context.
A better measure of heat in the climate system is shown in tidal gauge data dating back to the late 19th century. Ocean levels increase because of thermal expansion and melting of land ice mainly over Greenland and the Antarctic continent.
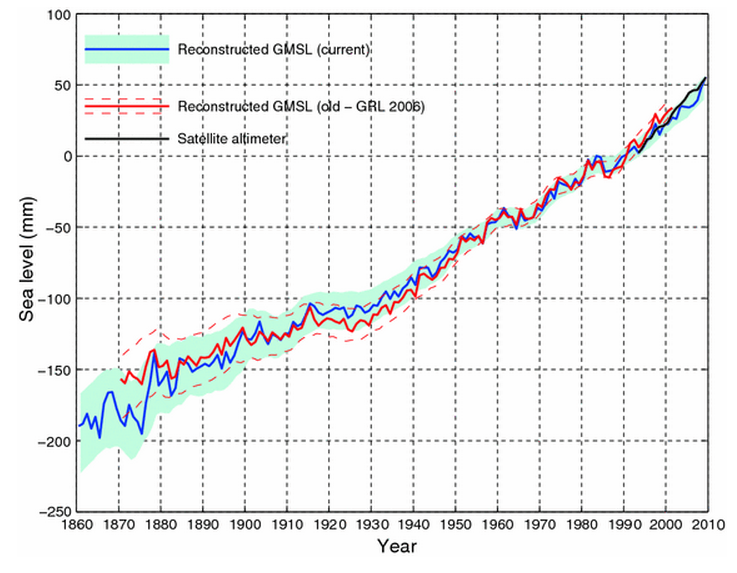
Sea levels are now rising faster than at any time during the past few 1000 years. See the Smithsonian National Museum of Natural History website. See, also the Royal Society page on Sea levels.
Rising sea levels are inevitable and are already affecting some island and coastal communities.See Scientists nearly double sea level rise projections for 2100, because of Antarctica
There are other, surrogate, indicators such as animal, insect and plant behaviour. Some of these are a worry in their own right. Mosquitos, including those creating problems of abnormal births in South America, are likely to become established in areas currently mosquito free.
Are increases in greenhouse gases really the cause?
We know that the earth’s climate goes through ice ages and inter[glacial periods due to slow changes in the orbit of the earth around the sun. In the depths of an ice age, the cold air can hold little water vapour and that life, animal and vegetable is at a minimum. As the orbit starts to result in a warming, there are several effects:
- Water starts to evaporate leading to increasing water vapour, a greenhouse gas enhancing the warming.
- The warming encouragers animal and vegetable life leading to a slow in crease in both CO2 and CH4 greenhouse gases that are more powerful, molecule for molecule, than water vapour.
- The extra warming results in more evaporation, leading to more heating.
After some 800 to 1000 years after starting to come out of an ice age, water vapour is the main driver for a warming climate but then the feedback effect comes into play. In the “natural” world, i.e. before the industrial revolution this cycle gave a sequence of temperature and CO2 as shown here.
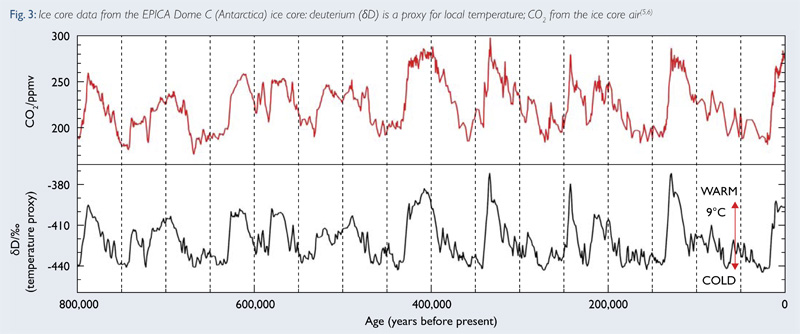
This shows how CO2 concentrations and temperatures have varied through several ice ages and inter-glacial periods. The proxy data for temperature equates to about a 10 degC range.
From https://www.bas.ac.uk/data/our-data/publication/ice-cores-and-climate-change/. This BAS study showed that the fastest rate of increase in CO2 concentration had been 20 ppm over a 1000 year period and the maximum CO2 concentration never exceeded 300 ppm. In recent years, we have seen a rise of 20 ppm in 10 years and concentrations up to 411 ppm/
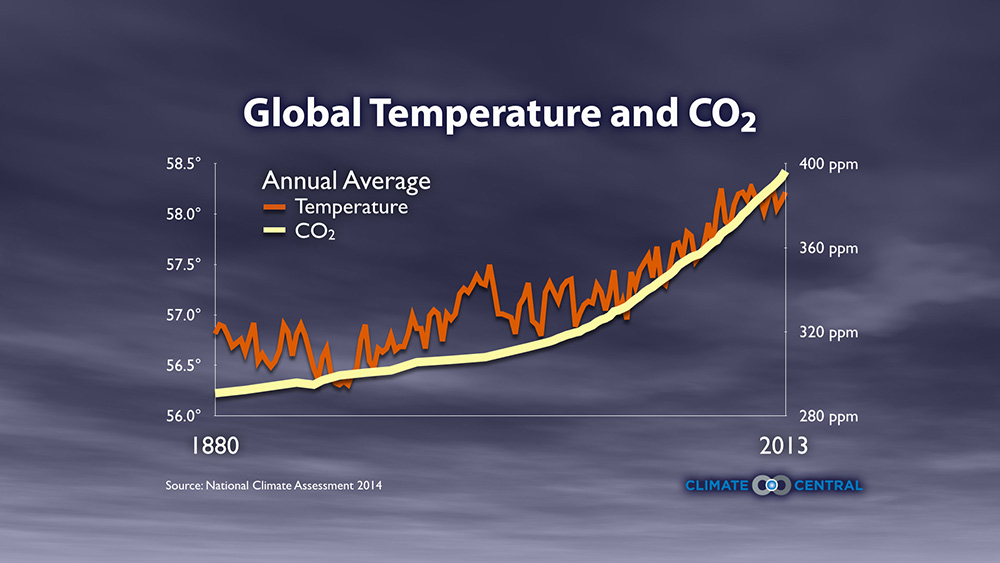
This shows CO2 concentrations and air temperatures.
And
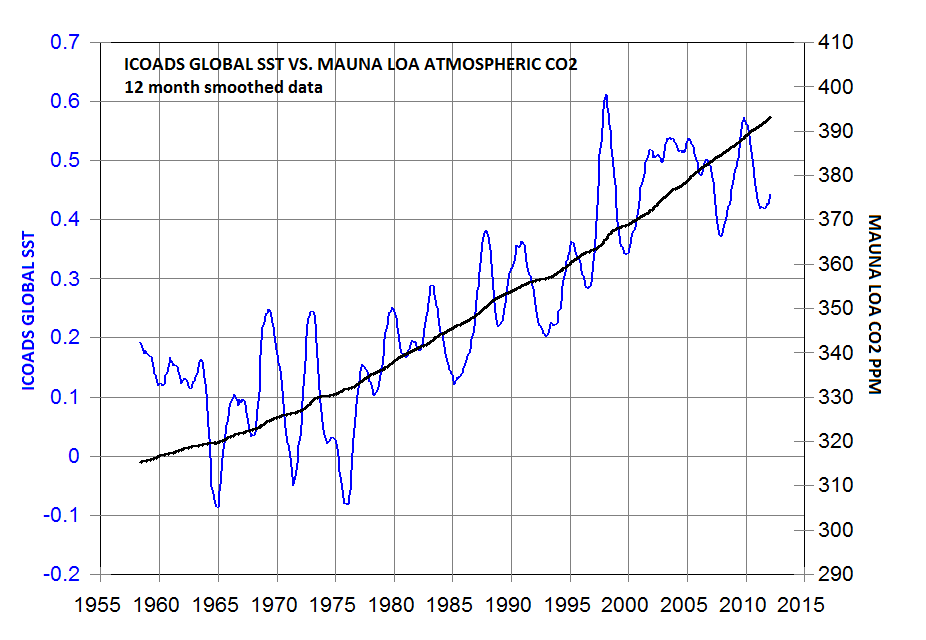
Showing CO2 concentrations and Sea surface temperatures.
There is an obvious upward trend in greenhouse gases but the rise in global temperatures is much more variable. This leads to understandable doubts and is a factor used by those that doubt that man is affecting the climate.
For those deep into statistics, these are four papers from reviewed literature.
Global Warming Is Driven by Anthropogenic Emissions: A Time Series Analysis Approach
Scaling fluctuation analysis and statistical hypothesis 7 testing of anthropogenic warming
Dep |endence of global temperatures on atmospheric CO2 and solar irradiance
On the causal structure between CO2 and global temperature
These all show that the probability that increases in CO2 are the cause of climate change is extremely high - > 1000 to one. A simpler, more easily understandable example of the use of statistics in studying climate change has been given in an American Statistical Society publication.
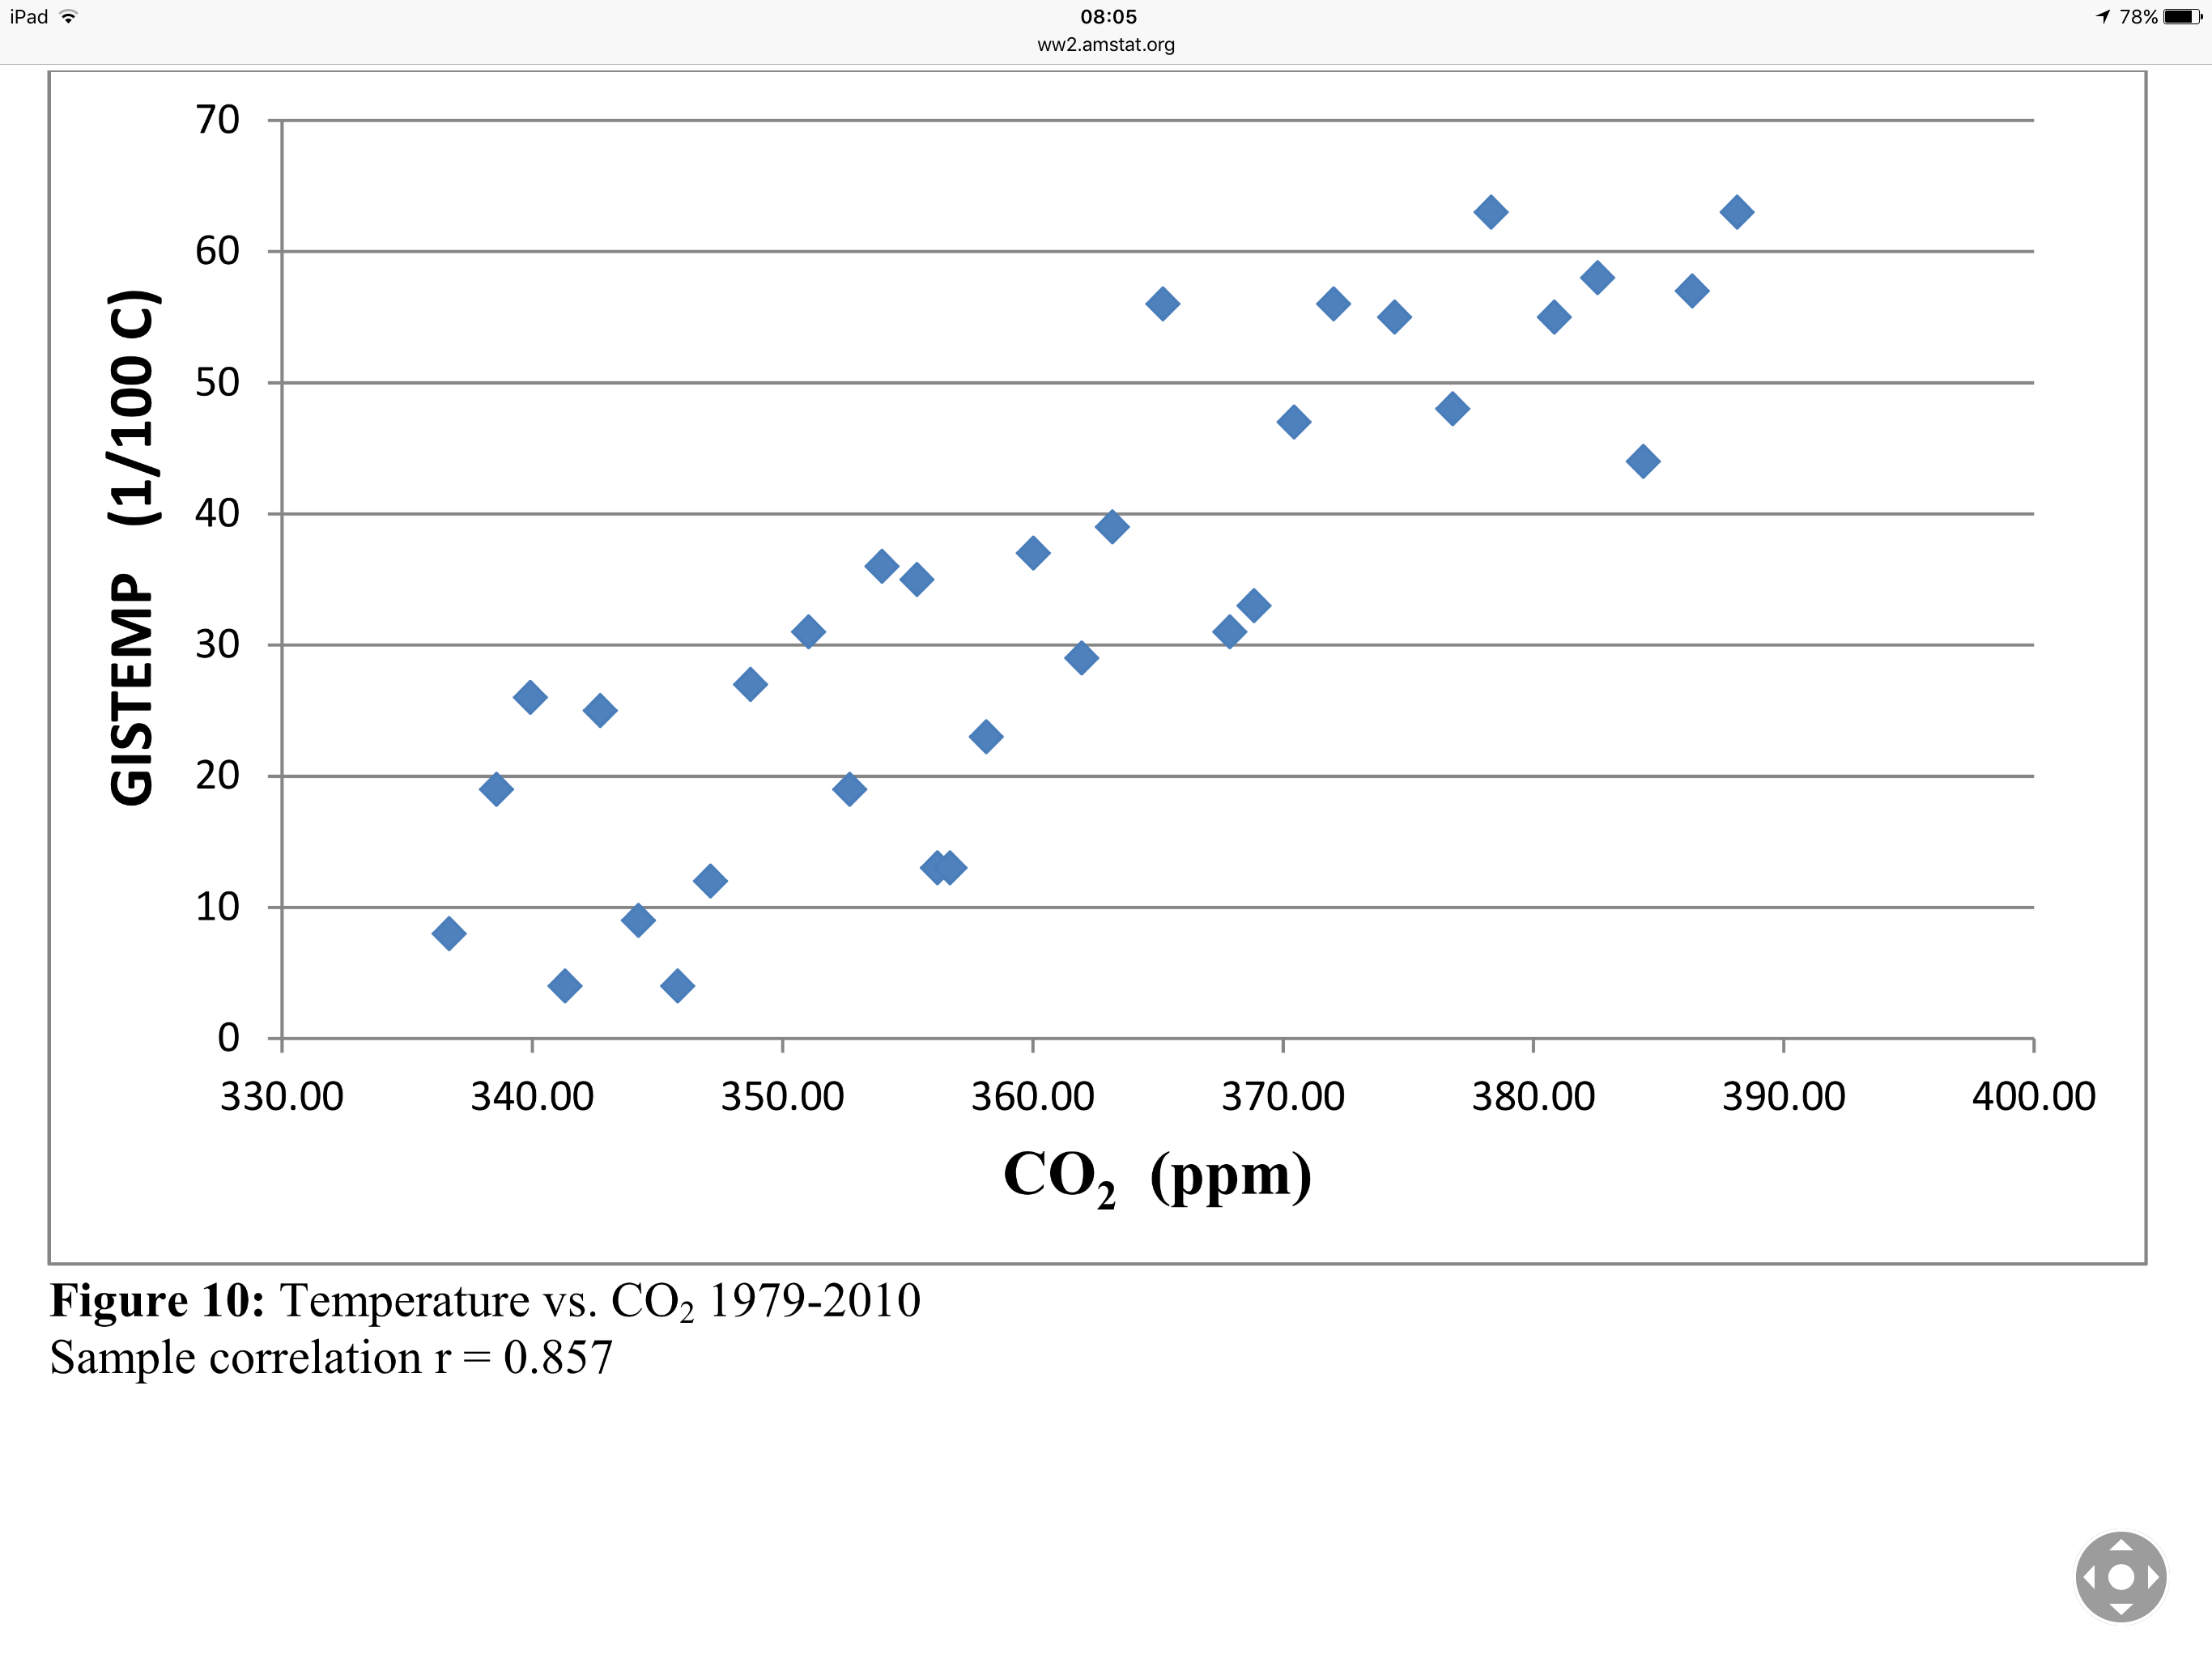
A correlation coefficient of 0.857 from a sample population of 32 pairs of data shows that the null hypothesis has a probability of less than 0.001. This follows from using Fisher's t-test.
There is no other mechanism by which heat input to the atmosphere can increase over timescales of a 100 or so years.
A recent (July 2019) paper in the journal Nature is
Consistent multidecadal variability in global temperature reconstructions and simulations over the Common Era. A more readablesummary version of this paper is in Science Daily/
This shows that events such as the Mediaeval Warm Period and Little Ice Age were regional rather than global events. Also, that the current rise in temperature is unlikely to be a natural event.
Associated with CO2 we have CH4. Increases in the former encourage vegetable and animal life with consequent increases in the latter. The next giagram shows how the two have changed over the past 1000 years.

This shows how increases in the two are related. Although amounts of CH4 are fare less the CO2 the absorption is dis proportionately greater - as is that of CO2 relative to H2O.
There are still doubters and deniers who claim that the warming since the industrial revolution are natural effects. I know of no evidence to support such claims and invite them to explain the fact set out in this section.
Are increases in CO2 due to man?
First, there is circumstantial evidence comparing the amount of CO2 in the atmosphere with the amount of fossil fuels used since the start of the industrial revolution.
More direct evidence comes from isotope analysis of CO2 in the atmosphere. This shows conclusively that man is largely the cause of increased greenhouse gases. See Stable and Radiocarbon Isotopes of Carbon Dioxide.
Model predictions
Climate models are, basically, the same models used nowadays to predict day-to-day weather although there are differences in the mode of operation. They do not attempt to prdict weather for a specific period but are used to develop a model climatology. By varying inputs such as greenhouse gas concentrations, volcanic activity, solar activity (sunspots), changing land use etc, climate outcomes can be calculated for different scanarios.
Climate models are far from perfect for several reasons. However, results from a large number of model runs by many different organisations have been collated.
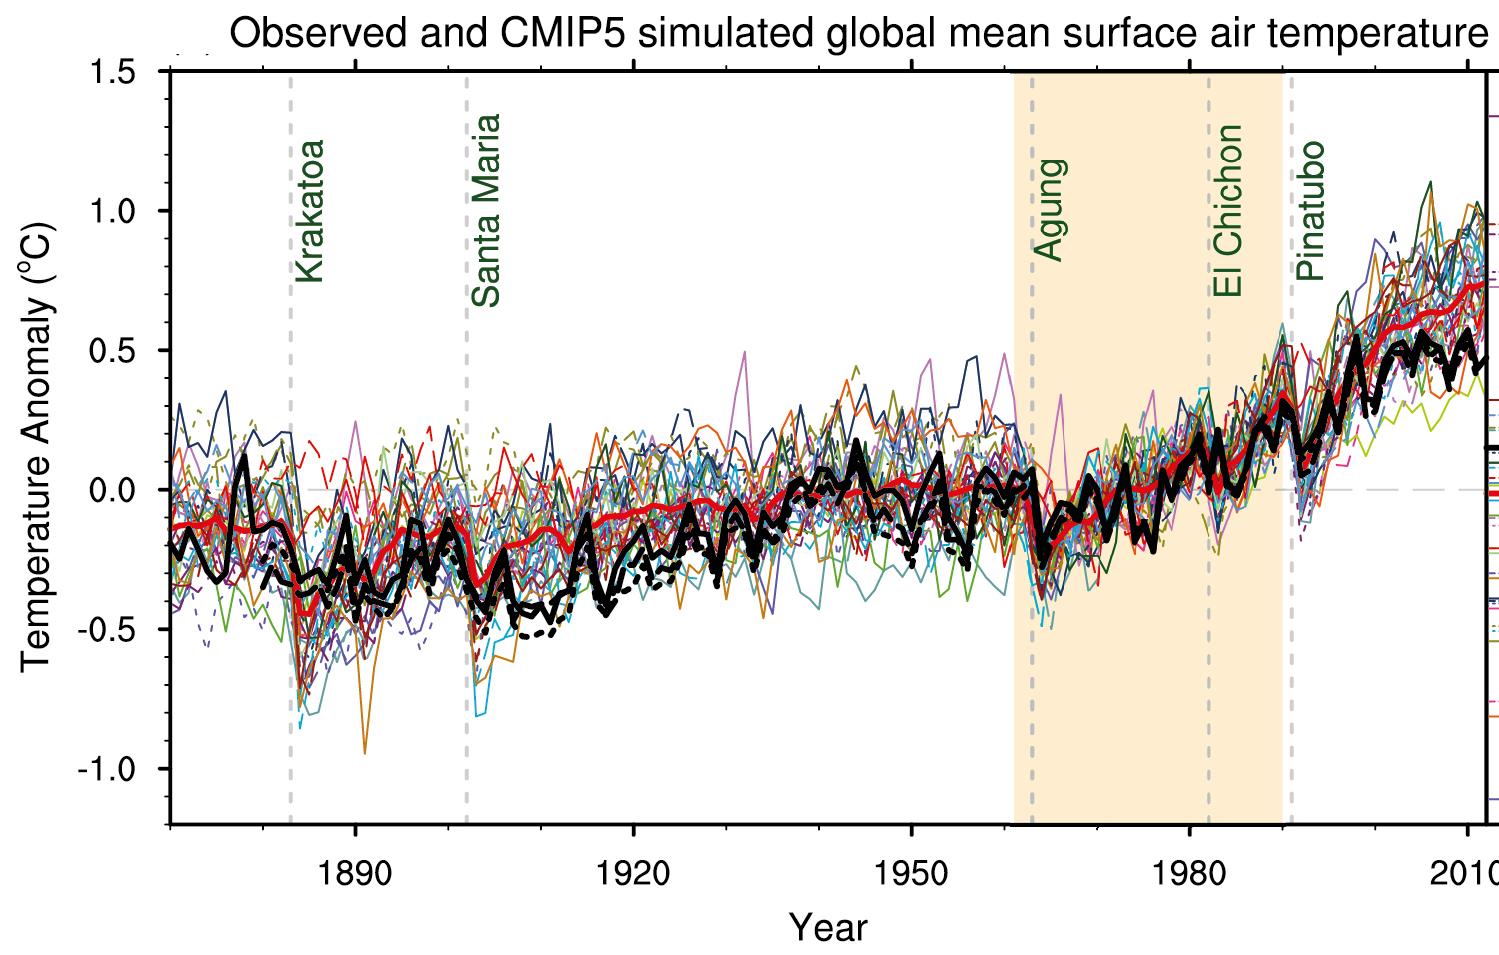
This is taken from th IPCC Panel 1 Assessment Report 4, WG1, Chapter 9, (2007), this shows how all the climate models were able to represent what actually happened since 1870.
The models can be run with various scenarios and the sensitivity of the climate to different factors estimated. The amounts of carbon dioxide, methane, sulphur dioxide and other gases can be varied and the different responses calculated and compared with observation.
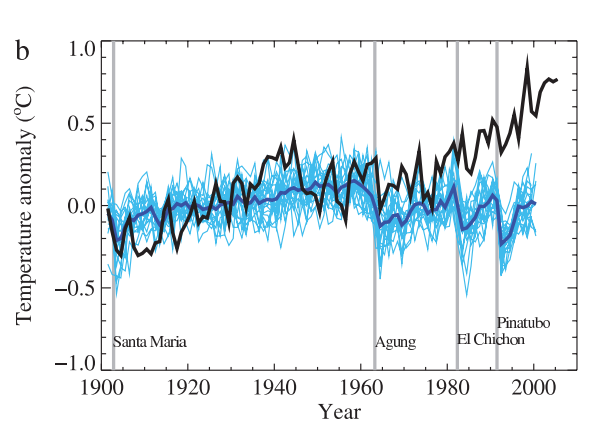
mythThis shows the results of climate simulations when increases in anthropogenic greenhouse gases are not included. The solid black line shows how air temperatures have actually changed since 1900. The blue lines show model simulations with the average shown as a solid blue line.
From the above, it is quite clear that observed increases in global average temperature since the industrial revolution are due, in large part, to man’s activities.
How can models be improved?
Obviously, I hope, the models might be improved by better representation of the physical processes that drive climate. That is an ongoing process. Not surprisingly there are “known unknowns.” One is random variation in solar emissions, another is volcanic activity. Major eruptions have a noticeable cooling effect. The next diagram shows a scenario using an eruption history based on ice-core records. The most major one used is an eruption in 1257. See https://www.nature.com/articles/nclimate3394#ref-link-abstract-1.
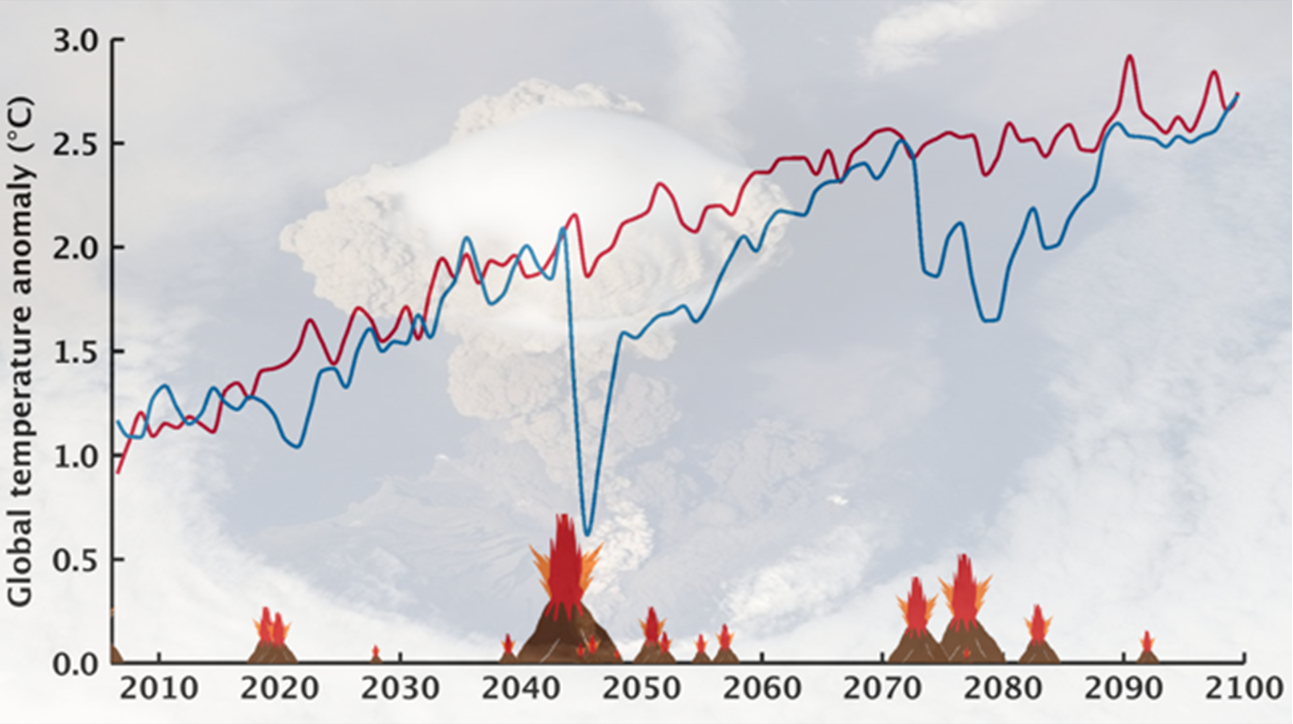
Global-mean temperature evolution with and without volcanic eruptions as simulated in the Bethke et al. study. The red curve shows how the temperature evolves from year to year in a simulation without volcanic activity. The blue curve shows the result for the simulation of the study with largest volcanic activity. Strong volcanic eruptions lead to periods of cooling that are generally followed by periods of accelerated warming. While making the climate more variable, volcanic eruptions have little influence on the long-term temperature trend. . This shows that, even with some massive eruptions, climate models still predict a significant increase in global temperature.
Climate scenarios
Climate models have been run under different scenarios of human activity. This has given a range of possible outcomes usually shown in diagrams like this. –
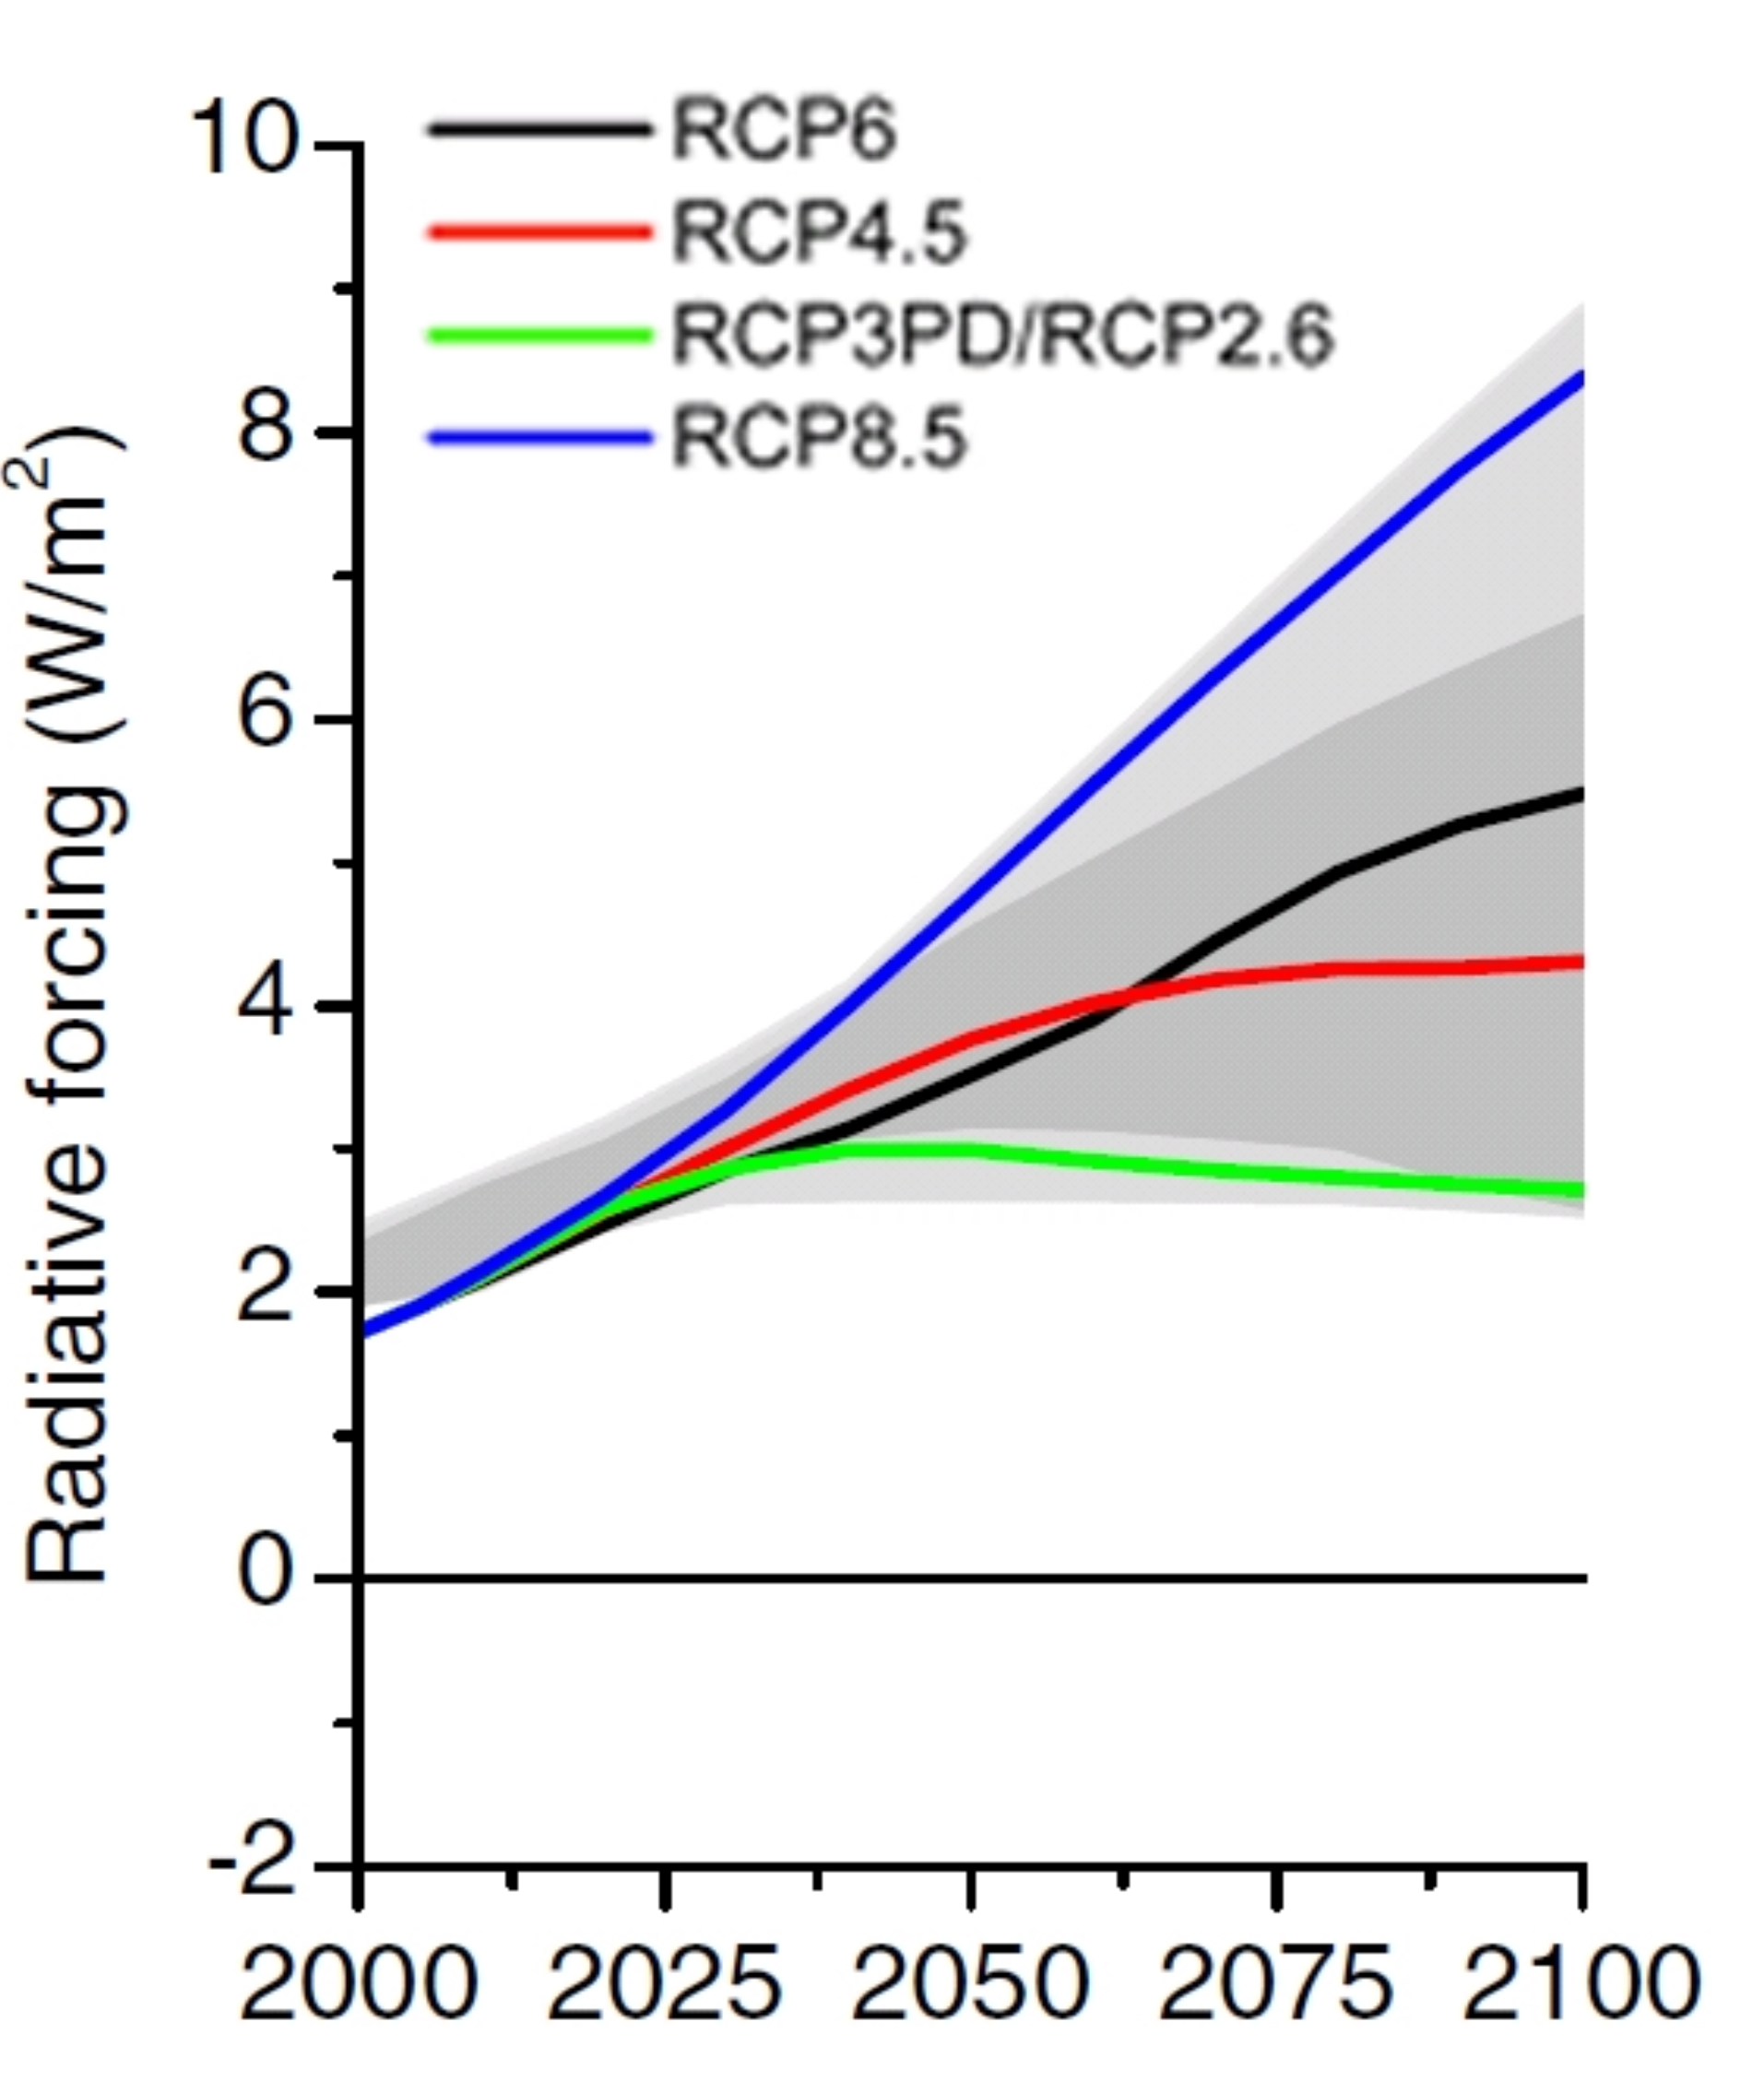
(SeeDescriptions of the IPCC AR5 scenarios.)
First, these scenarios can be refined. Secondly, there is scope to improve models but this will require further research to model better the effects of feedbacks, especially cloud.
Operational weather forecast models are run as ensembles. The initial conditions are varied slightly to account for uncertainties in the data analysis. A similar technique can be used with climate models, see Quantification of modelling uncertainties in a large ensemble of climate change simulation
And
Climate Ensembles. Ensembles enable an idea of probabilities of the various scenarios.
Otherwise, global climate change may or may not be bad for all. Local and regional variations are uncertain at this stage and sensible planning will only be possible after more studies.
What should scientists do next?
The first priority must be to improve understanding of the working of the climate system. Climate models have been shown to replicate climate pretty well in general terms although there are some factors that may never be well modelled. Climate science is well understood even if there are uncertainties in predictions. It would be useful to have a better idea about the El Nino/La Nina cycle and, maybe, even predict the effects although they do not contribute to long term climate change. Particular problems with models are related to feedbacks and the role of cloud is a major, yet unresolved, issue.
Impacts are less clear and much more difficult to assess quantitatively. Growing conditions will change; whole ecosystems will change; migrations of animals, birds and insects will all change with possible impacts on human and animal welfare. Effects are impossible to guess but the possibilities should not be assumed to be inconsequential.
Government and international actions should really come down to managing the uncertainties inherent in the science and the impacts. There are no clear-cut answers and much will depend on assessment of impacts. I am far from competent to make any categorical statements. Common-sense suggests (to me, at least) that governments and planners should take the most likely range of scenarios and act accordingly. They should then invest in improving understanding both the science and the possible impacts. They should then modify actions, keep them under review and plan accordingly.
Climate change myths
There are many of these put out by deniers and sceptics. Some are patently untrue; others are partial truths. An example is the statement that it is rising temperatures that releases CO2 from the oceans. That is the case when coming out of an ice age when vegetation and animal life is at a minimum. When vegetation develops and animal life becomes established then CO2 release from the oceans becomes a secondary effect, more of a feedback. This is discussed at https://scripps.ucsd.edu/programs/keelingcurve/2014/06/20/how-do-co2-levels-relate-to-ice-ages-and-sea-level/. The killer is the isotope result described earlier.
Two genuinely scientific sources of FAQs are the IPCC AR5 FAQs and the Royal Society Climate Change Summary. For those who like short, graphic explanations, try Climate Change in 60 seconds also from the Royal Society.
The bottom line
In my view, President Trump, clearly a clever man, is acting extremely unwisely. I have to wonder at the mentality of politicians who deny what is blindingly obvious and potentially dangerous to mankind. It is incredibly short-sighted to reduce funds devoted to studying the issues whatever is done about tackling global warming directly. It is always dangerous to predict political reactions, but I fully expect that other countries and their climate scientists generally will make their views known with considerable force.
Appendices
Satellite measurements of greenhouse gases
The earth radiates in the infrared wavelengths between about 3 and 100 µm (1 µm = one millionth of a metre.) Radiometers on satellites measure the radiation at specific wavelengths. The atmosphere is transparent to infrared between 10.6 qnd 12.5 µm, the wavelength used for infrared images of cloud and earth. The intensity of the signal is a measure of the temperature of the surface of the earth (where the satellite “sees” down to the surface. At other wavelengths, there is absorbtion by the various gases. Ware vapour absorbs at about 6.3 µm and at wavelengths > 15 µm. Because they know how much heat is being radiated, measuring the intensity in these wavelengths gives a measure of the absorption due to and, therefore, the amount of water vapour.
CO2 absorbs mainly at three narrow wavelengths 2.7, 4/3 and 15 µm. Measuring the intensity of the radiation gives a measure of CO2. Similarly, amounts of CH4 and N2O can be measured.
Warm and cold periods in our recorded history.
Several of these are marked on the Gutenberg University diagram above. One is the Mediaeval Warm Period lasting from around 950 to 1250 CE. There is considerable uncertainty about the global extent. Proxy data show causes were a period of below normal volcanic activity and above normal solar activity. The Romao-British and the Dark Ages cold periods were also, apparently, regional rather than global phenomena.
The Little Ice Age, roughly 1300 to 1850 CE, was longer lasting and more complex than the other. There were periods of excessive volcanic eruptions and low solar activity. One such is known as the Maunder Minimum, 1645 to 1715 CE, when sunspots were exceedingly rare.
A recent UCL study has suggested that human effects might have been contributory factors. Prior to the arrival of Columbus in the New World there had been around 60 million people in South America with about 600 million worldwide. About 100 years later there were only about 6 million, largely because of diseases and massacres. Vast areas of cultivated land were rapidly returned to forests.
Calculations show that consequent reduction in CO2 might have added to and enhanced the naturally occurring cooling. It sounds plausible but the jury is out on this one as far as I am concerned. It doe show or suggest, at least, the importance of natural sinks for CO2.
Ozone
Ozone (O3) is a natural gas that is subject to human effects. O3 is formed in the stratosphere when ultraviolet radiation from one part of the solar spectrum causes disassociation of oxygen (O2) at low stratospheric pressures, to create O1. These free molecules combine with O2 to create O3. This gas blocks UV in another part of the spectrum and helps to protect us from skin cancer. CFCs, from aerosol cans for example, and other man-made gases reach the stratosphere and destroy some of the O3 resulting in a triple whammie.
- Cancer risk is increased.
- More UV reaches the troposphere giving more heating.
- CFCs are also greenhouse gases in the troposphere.