
On this page
What a GRIB file looks like
Preamble
To most of us, GRIB messages are just something that a clever bit of software translates into a chart of vector winds, isobars, rain areas etc. This is for those with minds enquiring enough to wonder what files actually look like.
Example file
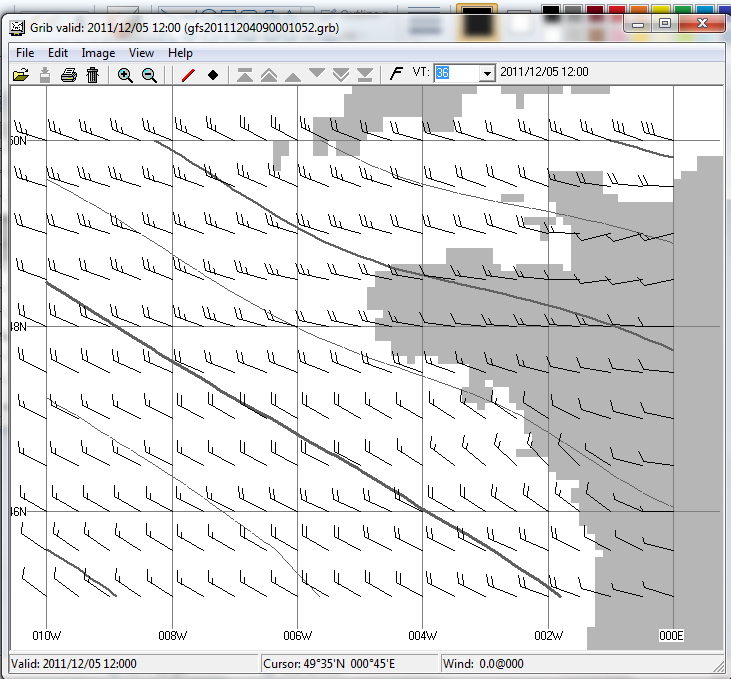
For the purpose of this exercise, I sent this request to Saildocs-
send gfs:45N,50N,10W,0E|0.5,0.5|0,12,...,72|
That asks for winds and pressures between the latitude/longitudes shown, at a spacing of 0.5 degrees and 12 hour intervaks from T=0 to T=72 hours.
At the time, I was using the basic ViewFax with this result.
This used to have a facility that I have not found in other viewers. Using File-Save As to save in text form ie as a .txt file used to give the message format in plain text.
The GRIB message text form
From the viewer, using the Save As gave a text file with blocks of numbers each preceded by a string of numbers. There are data for 3 parameters (west/east and south/north wind components and pressure) at 7 times making a total of 21 blocks looking like this -
[Record 0]
Center=7
Process=81
GridID=255
Parameter=U GRD
Layer=105/10
Date=2011/12/04 00:00
Valid Time=0
LatPts=11
LonPts=21
Lat=45°00'N,50°00'N
dLat=0.50
Lon=350°00'E,000°00'E
dLon=0.50
Flags=11
Data Values:
 10.2,  10.3,  10.5,  10.7,  10.9,  11.2,  11.5,  11.8,  11.9,  12.1,  12.1,  11.9,  11.8,  11.6,  11.3,  10.9,  11.2,   9.6,   4.0,   2.5,   3.2
 11.4,  11.5,  11.6,  11.7,  11.8,  11.8,  11.6,  11.6,  11.6,  11.6,  11.5,  11.3,  11.1,  10.9,  10.6,  10.3,  10.7,  10.5,   6.4,   3.5,   3.6
 12.0,  11.9,  11.9,  11.9,  12.1,  12.1,  11.8,  11.6,  11.4,  11.3,  11.0,  10.7,  10.4,  10.2,   9.9,   9.8,  10.2,  10.0,   6.5,   3.8,   3.8
 11.7,  11.7,  11.8,  11.8,  11.9,  11.8,  11.6,  11.5,  11.4,  11.1,  10.7,  10.4,  10.2,   9.9,  10.0,  10.2,   8.9,   5.7,   4.0,   3.9,   4.2
 11.3,  11.2,  11.3,  11.3,  11.3,  11.0,  10.7,  10.5,  10.4,  10.3,  10.0,   9.8,   9.8,   9.9,  10.4,   9.6,   5.9,   4.0,   4.1,   4.4,   4.3
 10.8,  10.9,  10.9,  10.8,  10.6,  10.4,  10.3,  10.1,   9.8,   9.5,   9.3,   9.3,   9.0,   8.3,   8.2,   6.9,   4.7,   4.2,   4.4,   4.4,   4.2
 10.7,  10.8,  10.9,  10.8,  10.7,  10.6,  10.4,  10.2,  10.0,   9.7,   9.2,   6.8,   4.1,   2.9,   3.1,   3.7,   3.9,   4.1,   4.4,   4.4,   4.0
 10.8,  11.0,  11.1,  11.2,  11.2,  11.1,  10.8,  10.6,  10.4,  10.2,   9.7,   7.4,   4.9,   4.0,   4.7,   5.9,   5.6,   5.0,   4.8,   4.6,   4.1
 10.3,  10.4,  10.6,  10.9,  11.1,  11.1,  10.9,  10.6,  10.3,  10.0,   9.9,   9.8,   9.9,  10.1,  10.8,  12.1,  11.9,   8.3,   6.2,   5.6,   5.1
  9.1,   9.4,   9.9,  10.4,  10.8,  10.9,  10.7,  10.4,   9.9,   9.6,   9.5,   9.8,  10.5,  11.5,  12.2,  12.8,  12.3,   9.7,  10.5,  11.4,  10.2
  9.1,   9.4,   9.9,  10.4,  10.8,  10.7,  10.2,   9.6,   9.2,   8.7,   8.5,   9.0,  10.0,  11.1,  12.0,  12.7,  13.1,  13.1,  12.9,  12.6,  11.8
In this case the block of numbers comprises 11 rows and 21 columns.
What all this means
In this case, Record goes from 0 to 20, ie a total of 21 blocks of data.
Parameter is U GRD for Records 0 to 6. These are the west to east components of wind. For Records 7 to 13, Parameter is V GRD. That is the south to north component of the wind. For Records 14 to 20 Parameter is PRMSL, the surface pressure
NOTE winds are in metres per second.
Date is the T=0, ie the DTG of the data upon which to forecast is based.
Valid time is the time to which the following data block refers.
LatPts and LongPts are the number of rows and columns in th following data block.
Lat gives the range of latitudes and dLat gives the spacing betseen latitude rows.
NOTE Longitude is counted eastwards from the Greenwich meridian so that 10° W is 350°00'E
Lon and dLon does the same for longitude.
NOTE With Saildocs it is possible to have a different spacing for rows and columns. It is also possible to have a variable ime interval
The other headings are of no interest to the casual user
The full message is shown on another page
Home -'