
About this page
What GRIB files are and a word of warning.
Preamble
GRIB files provide a low cost way of getting a great deal of weather forecast information. There is much misunderstanding of GRIBs, some of it fostered by unrealistic accuracy claims by those selling GRIB services and products. I hope that this and the associated pages will help users to know what they are getting, how to assess what is available at no cost and to avoid paying unnecessarily.
On other pages of this site see
About Numerical Weather Prediction
What they are.
GRIB files are output direct from Numerical Weather Prediction (NWP) models. Values are on a 3-D grid of points. Those of most interest to sailors are wind, rainfall, swell although there are many others.
Where do they come from?
All National Met Services (NMS) use GRIB files to store and exchange forecast data. However, few release them for general use. Exceptions are
- US National Weather Service (NWS) – a part of NOAA,
- US Navy
- Canadian Met Service
- Météo France
- German Weather service (DWD)
- European Centre for Medium-range Weather Forecasts (ECMWF)
- UK Met Office
Apart from the last two, all make nuch data freely available to anyone with the computer resources to handle massive data sets. Since 1999, GRIB data have been available from the US GFS (General Forecast System). In recent years data have been available from other centres. ECMWF makes a limited amount of information available free of charge,
To see what GRIB filess do in practice, see the GRIB examples page. This show forecasts for days 1 to 7 days ahead.
Global forecasts
Forecasting beyond 12-24 hours ahead requires global models partly because weather can travel a long way in 24 hours and, more importantly, because there are long distance connections; weather occurring in one area can affect what happens far away. NWP models usually use grid lengths (spacing) of about 0.1° to 0.125° latitude/longitude roughly 10-13 km. The smallest feature that they can represent meteorologically is about five times the grid spacing ie over 50km or 30 nautical miles. This known as the “Effective Grid Length”
NOTE Although the GFS uses a grid of about 1/8 degree lat/lon, 13 km, the data are only made available by NOAA on a 1/4 degree grid ie around 25 mile spacing.
This has implications for those who use the degraded data as a basis for high resolution (Limited Area or Meso-scale) models without using the mass of fine scale data available- see below.
Getting the information
There are four routes by which we can get global forecasts at no cost, except for communications.
1. By email.
These are not the easiest to use but the most flexible. For those with limited bandwidth, say over satellite phone or HF/SSB radio, it may be the only option. Data are saved automatically.
2. By FTP (File Transfer Protocol)
- XyGrib A comprehensive service with many data options. For Windows, Mac OSX and Linux. Data are saved automatically.
- Tablet Apps. There are many offering a range of options for both Apple and Android devices as well as laptops.
Data are usually saved automatically. For a list of free and some commercial options see my GRIB listing page. Look for PocketGrib, WeatherTrack, Weather4D, iGrib, SailGrib.
3. By browser.
The GRIB listing page include Weatheronline, PassageWeather, XCWeather, Windfinder, WindGuru, for examples. These are easy to use, provided you have the bandwidth. The main disadvantages are that data are not saved and the choice of areas, data, etc is limited. Data are not saved.
4. Instant Global views.
Both these offer a large range of GRIBs; Windy.com is a free source of ECMWF data. Neither can be saved for later viewing off-line.
GRIB files received by email or FTP can usually be viewed using a variety of viewers. each has its pros and cons. See my GRIB viewer page for some alternatives.
Small scale forecasts – Meso-scale or Limited Area Models (LAMs)
Meso-scale models set out to predict on scales smaller than can be seen on synoptic charts. Grid lengths can be down to around 1 km. For several reasons – such as the short lifetimes of small scale weather, the general variability of weather – these are not very useful to most sailors. I never recommend paying for them.
File Sizes
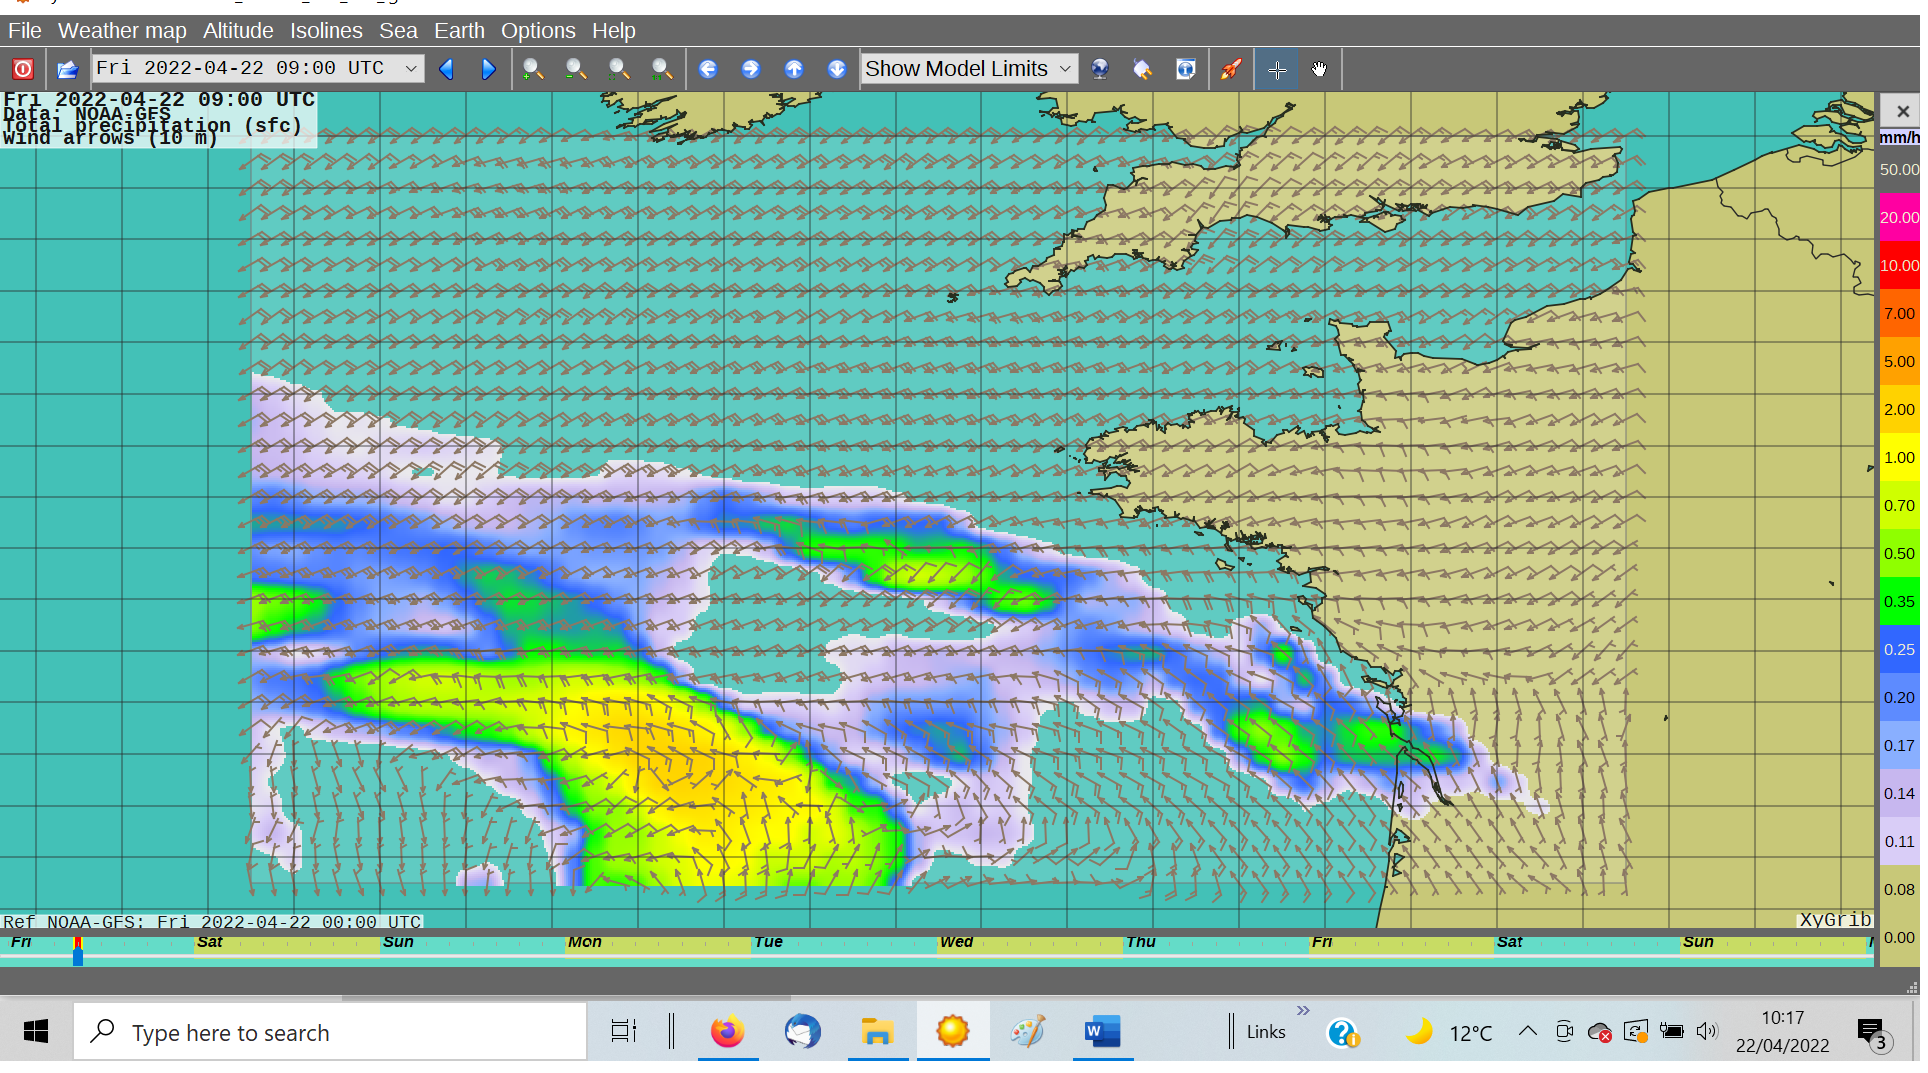
If you are using a satellite phone then files sizes can be critical. A file of a 10-day forecast of wind and rain for an area 7°latitude x 14°longitude on a 25km (0,25°) grid would be about 345kB and look like this
Using a 100km resolution would use about 43kB and look like this
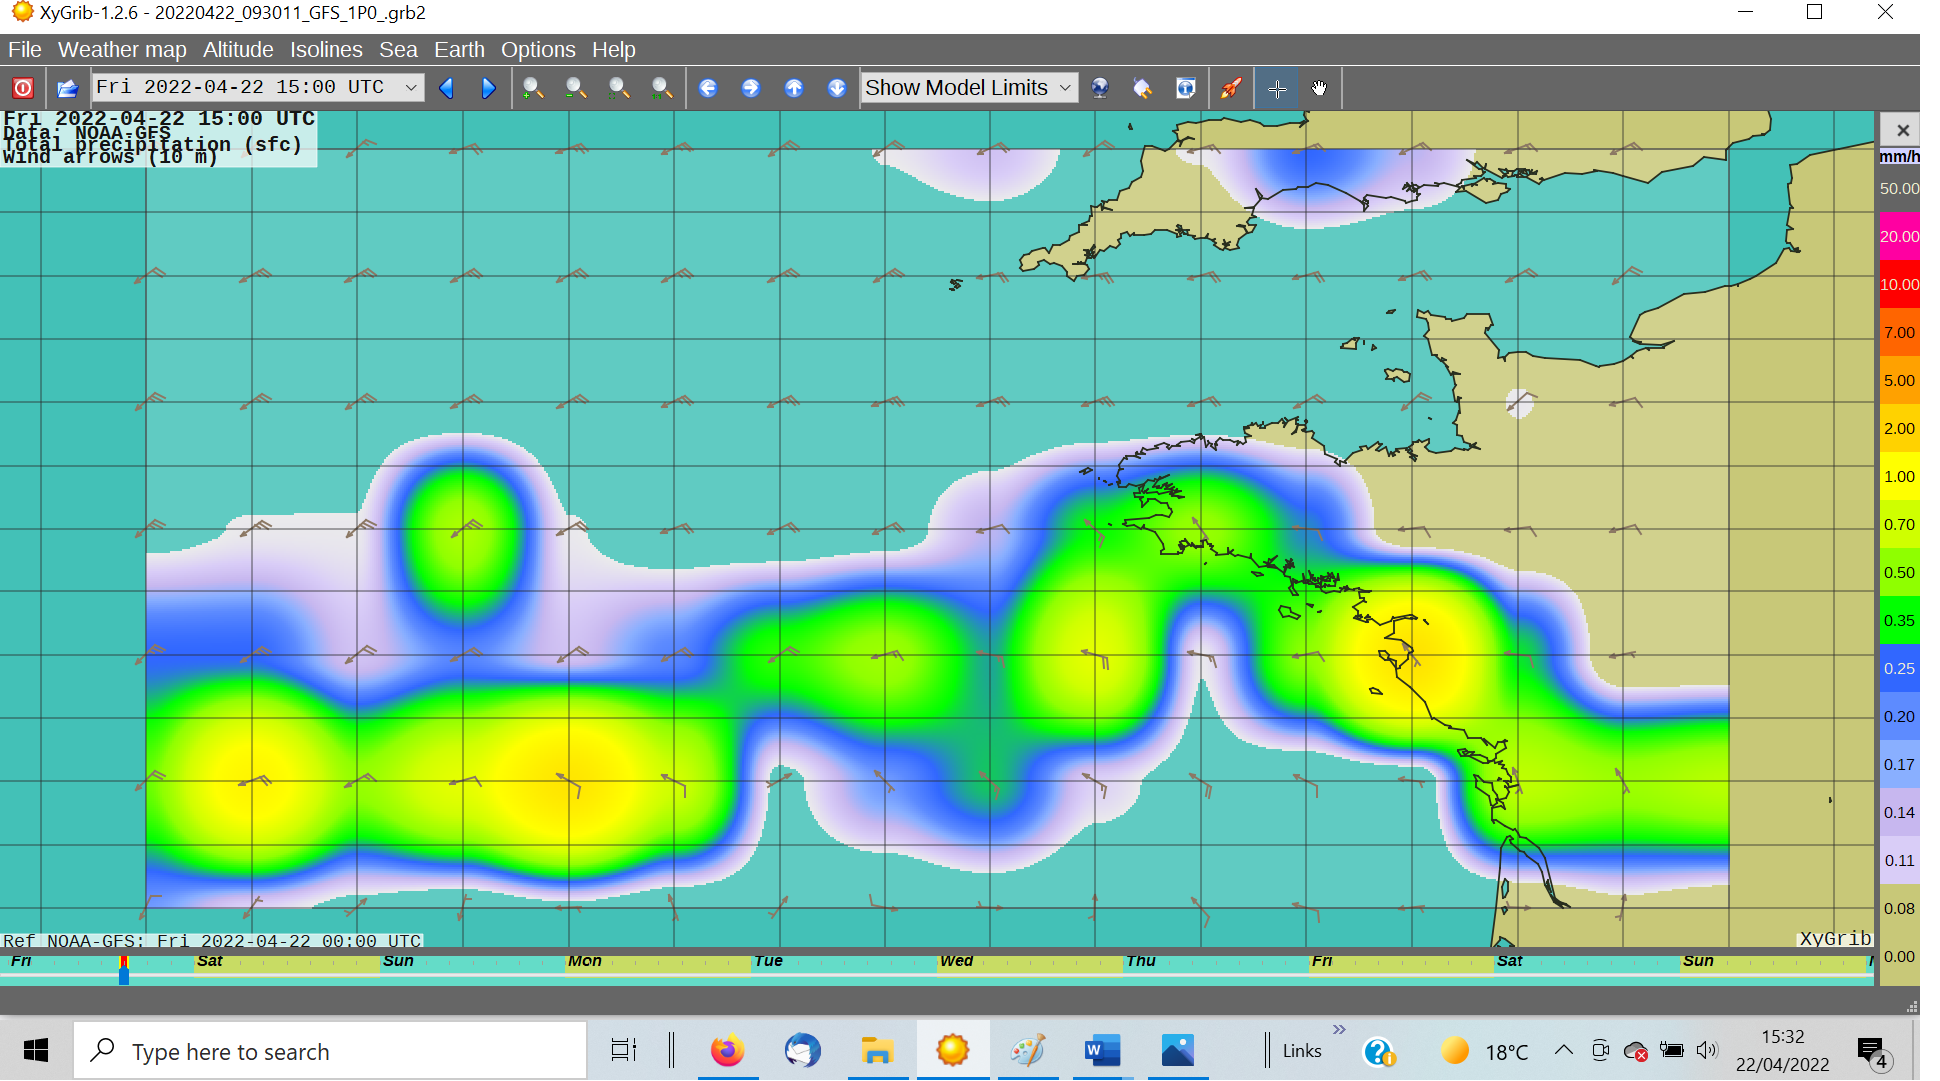
There is, clearly far less data but, arguably, virtually as much information
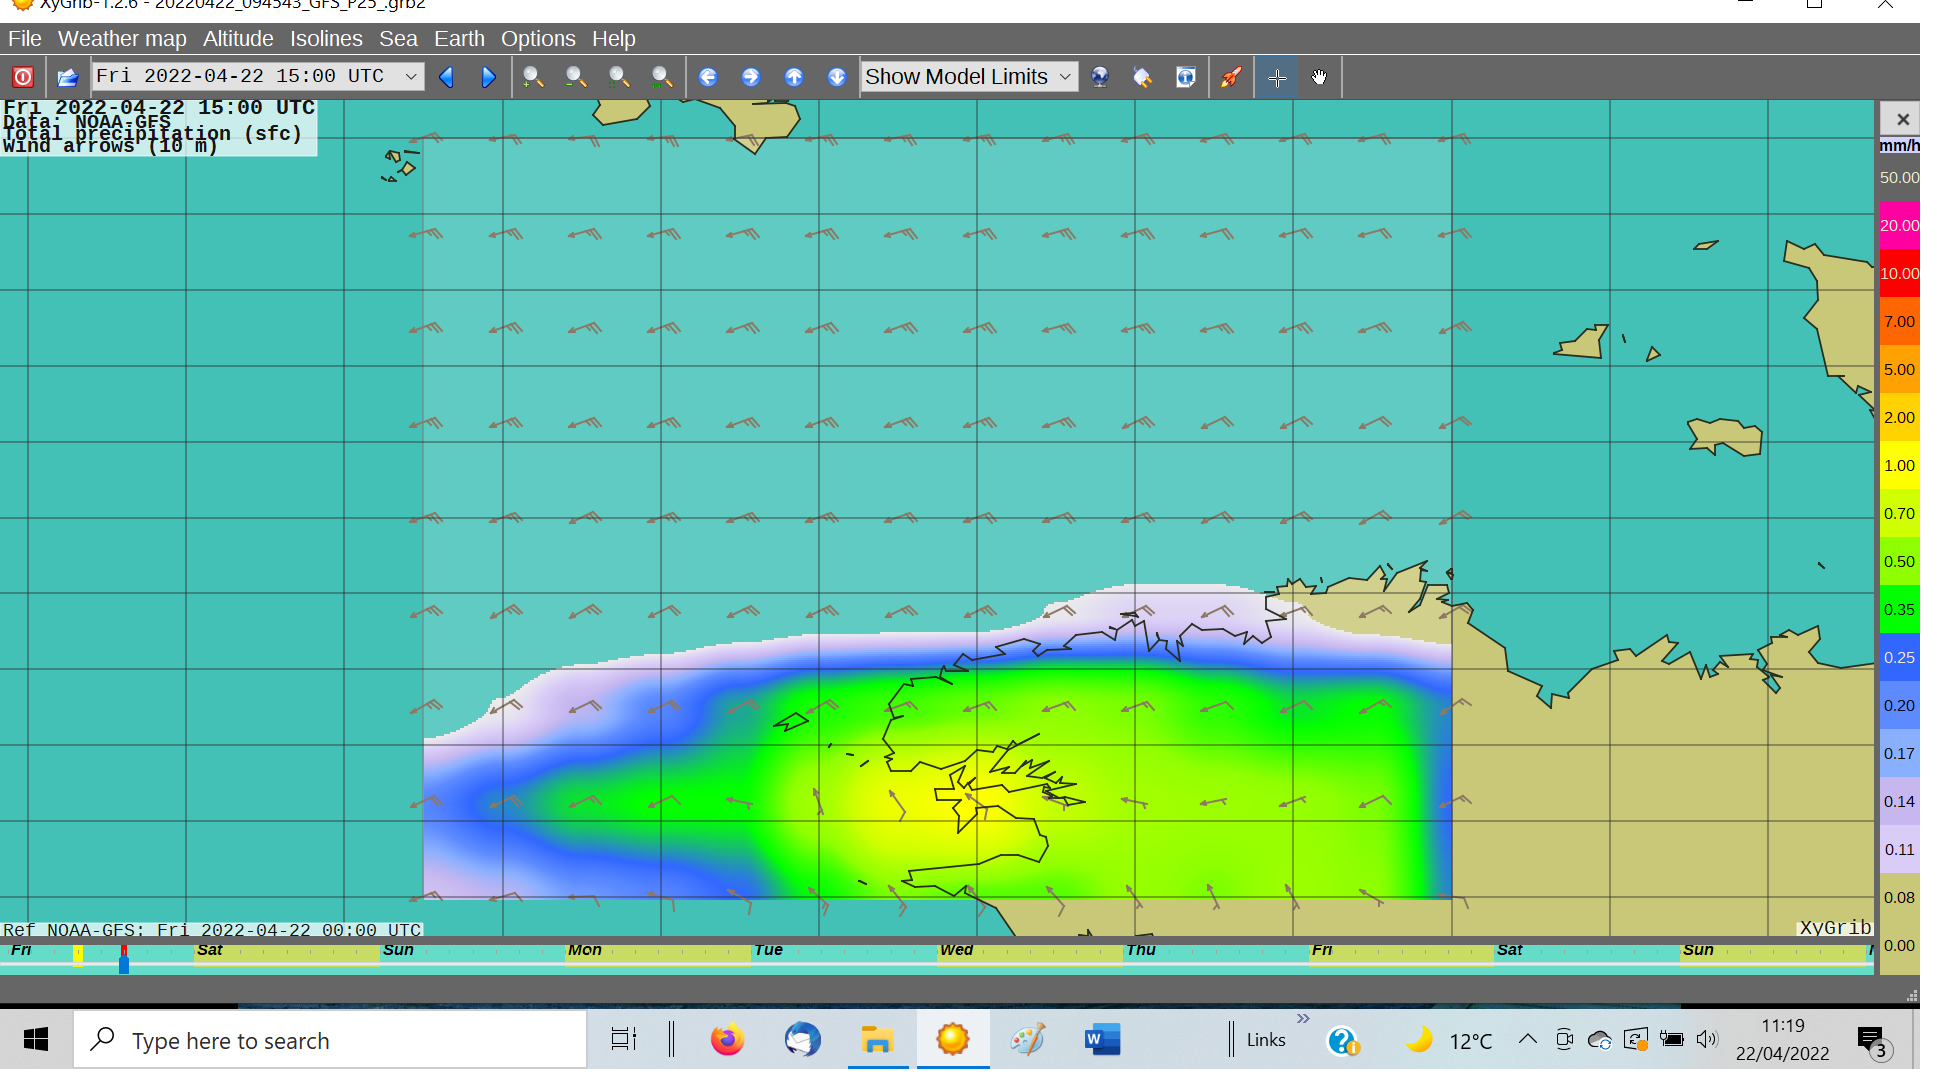
A file size of 435kB and a 25km resolution would give area 2°latitude x 2.5°longitude, such as
For most of us, most of the time these file sizes will not matter.
Cautionary NOTE -
From whatever source, it is important to remember that GRIB files are computer generated forecast files from a National Weather Service computer. These are sent without review, and are offered on an as-is basis. There is no assurance that the data are available, accurate or correct. Systems providing information and the computer models are automated and subject to a variety of failures and errors. By using the data, users acknowledge and agree to these limitations.
It should be remembered that human forecasters can still add value to computer model output. Consequently, the prudent Sailor will only use GRIB products in the short term (say up to 24 or 36 hours) in the light of other sources of information eg text forecasts, forecast charts generated by man-machine-mix, from the UK Met Office for example, or satellite pictures. For longer term predictions - say over 48 hours to seven or eight days, the basic computer output is unlikely to be improved upon by a human to any great. However, when preparing forecast charts at 4 and 5 days ahead. forecasters at the UK Met Office do look at other forecasts from other centres and try to produce a "best" forecast from a consensus point of view.