
About this page
Links to weather charts from the UK and other national Met services. Brief exlanations for these are given by links to another page.
Related pages
On this page -
- UK Met Office Charts
- HIRLAM meso-scale
- Computer Output
- Plotted charts
- Other Links to Charts - including archived charts
European Met Service charts
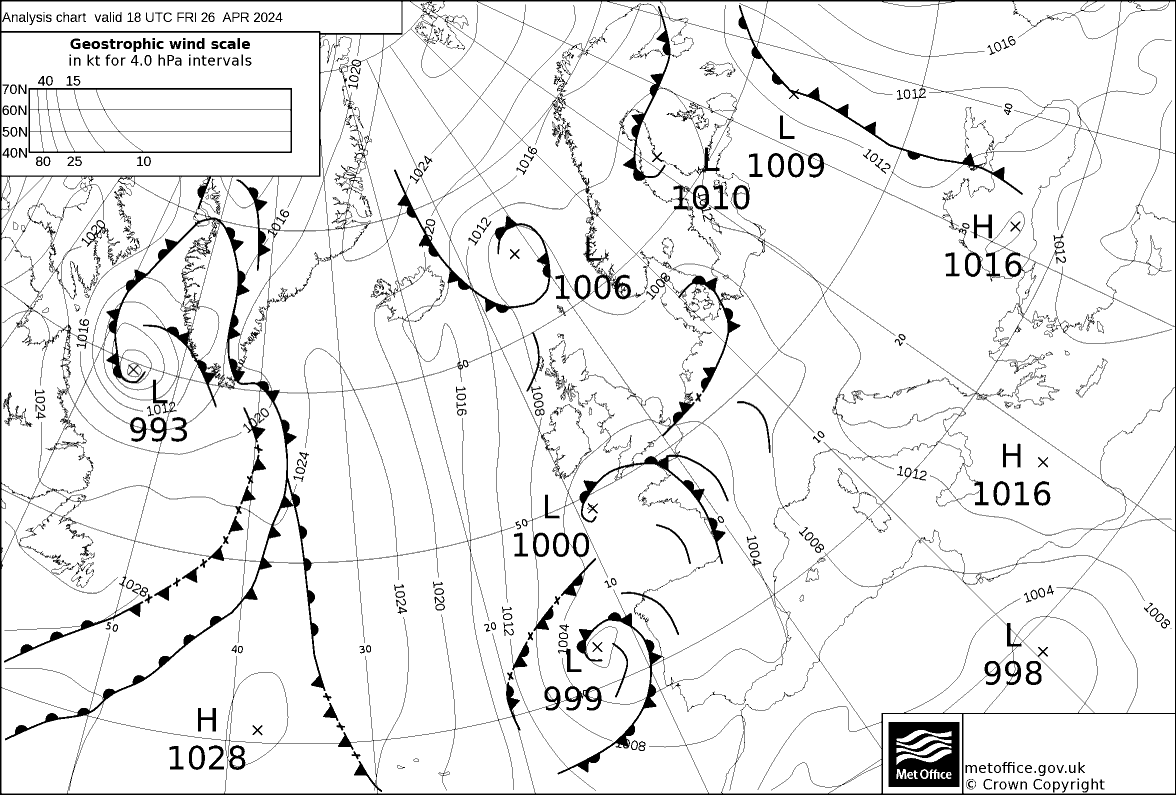
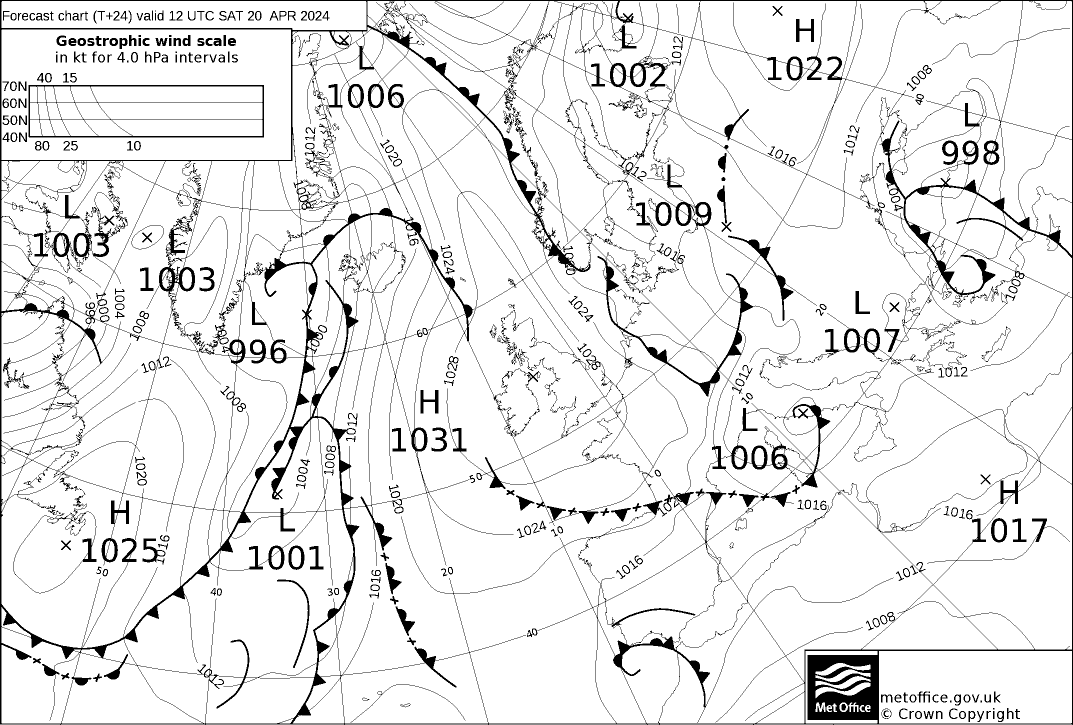
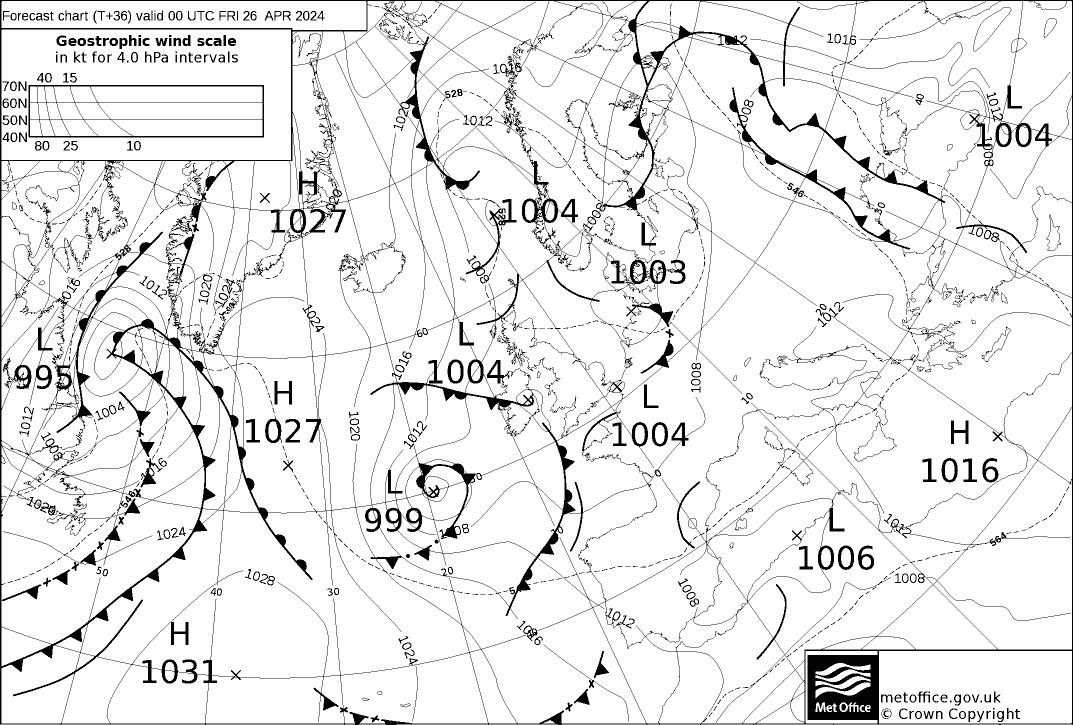
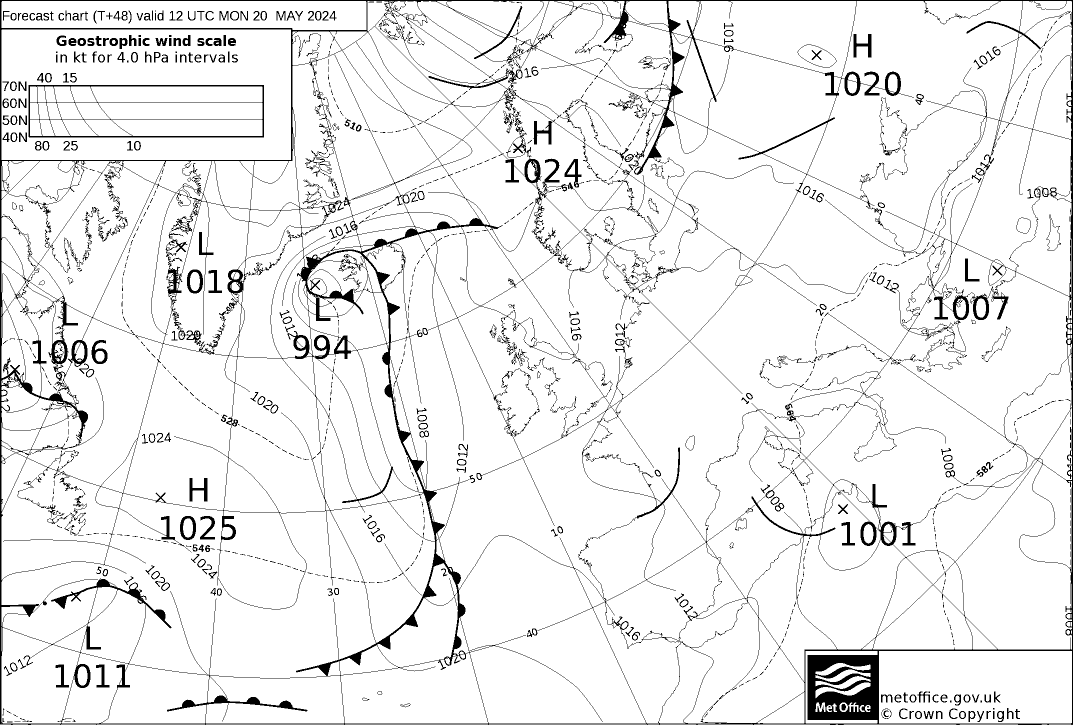
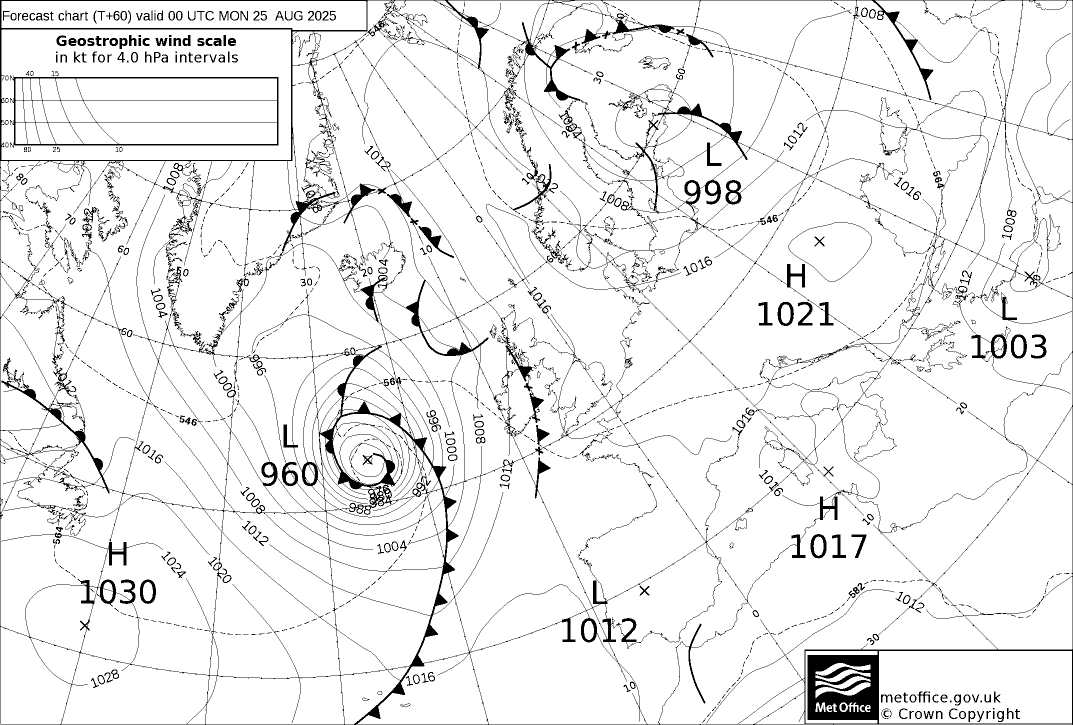
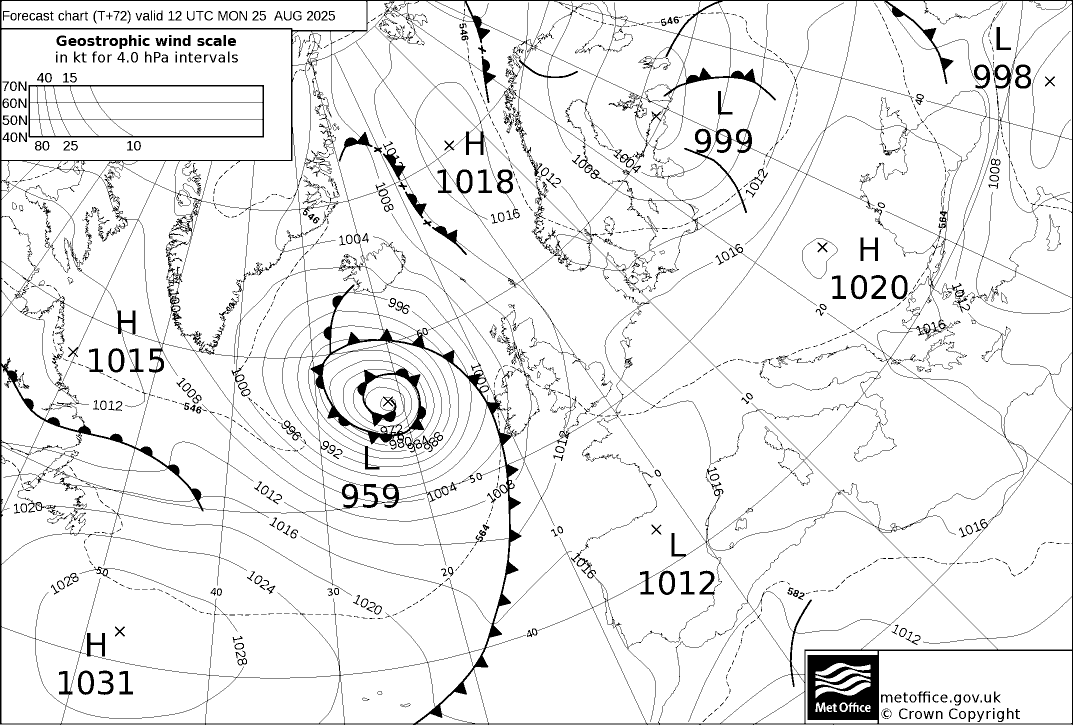
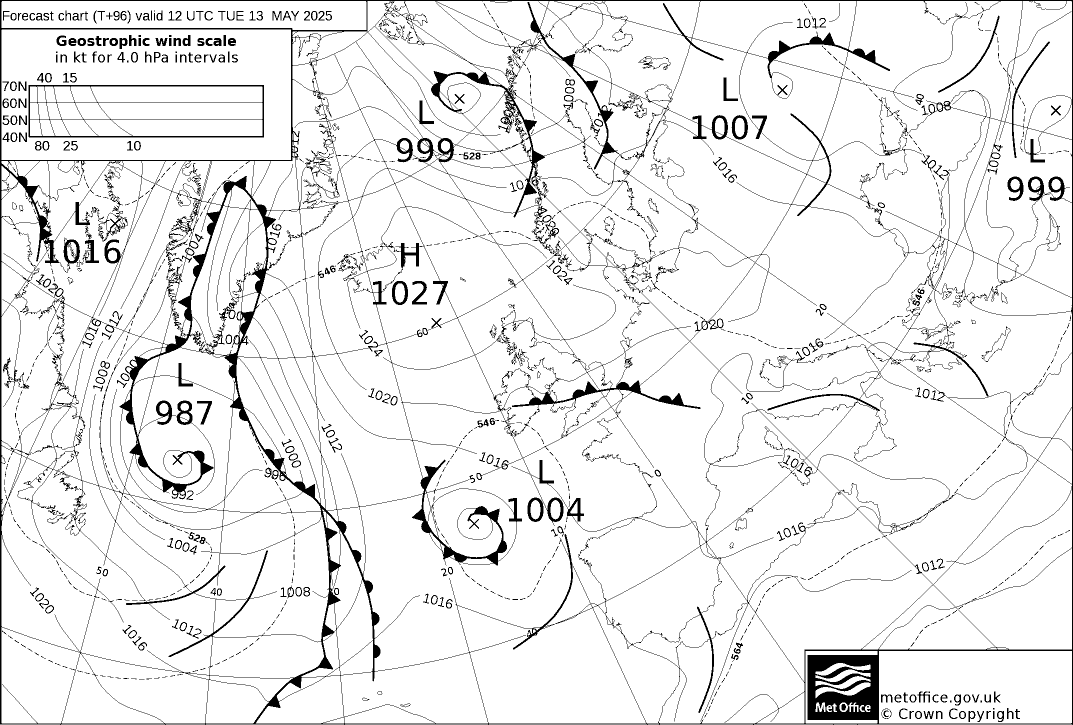
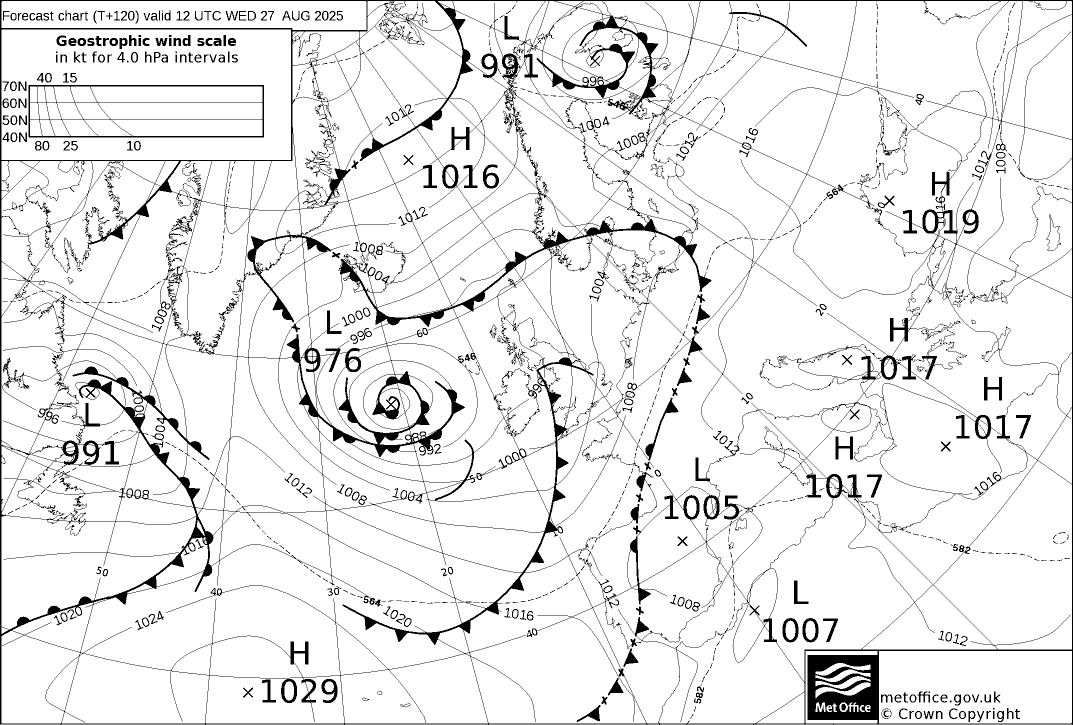
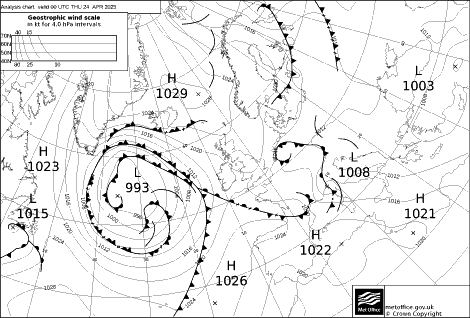
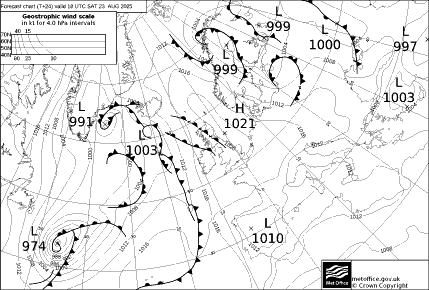
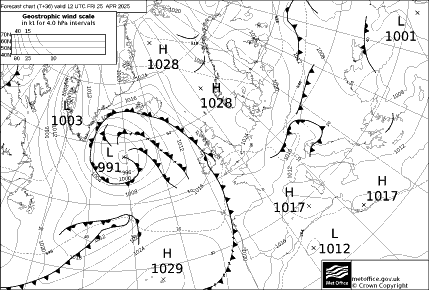
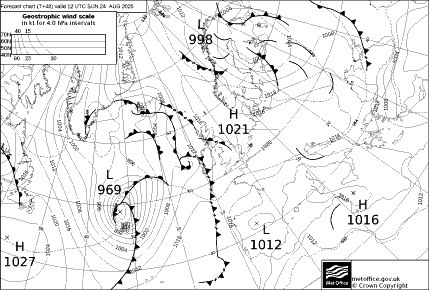
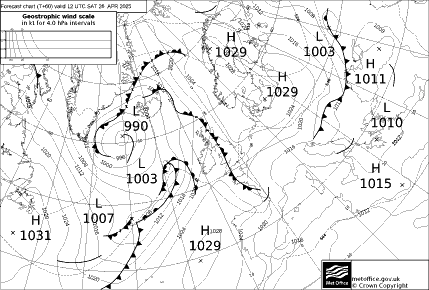
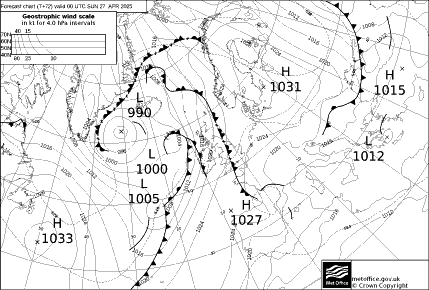
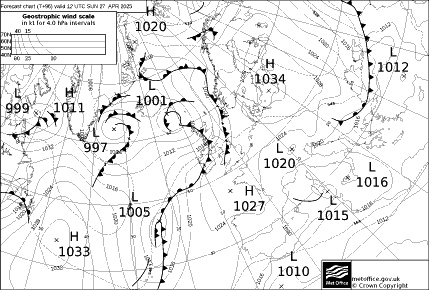
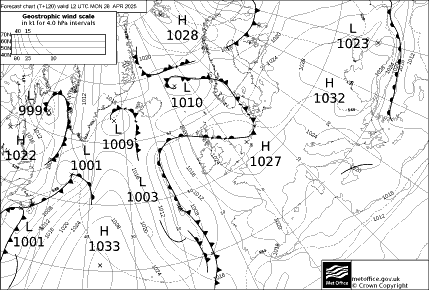
UK Met Office Charts - Isobars and fronts - North Atlantic/Europe.
Links are given here; the size of each chart is about 60 kb which is significant if using a cell or satellite phone connection.
 |
 |
 |
 |
 |
 |
 |
 |
Times of issue
- Analysis charts are usually available by HH+0320
- 24-hour forecasts by HH+0520
- T+36 and T+48 forecasts by 0620/1820 UTC
- T+60 and T+72 forecasts by 0720/1920 UTC
- T+96 and T+120 forecast are only issued once a day, based on 1200UTC data, usually available after 2320UTC
Chart sequences
To see a sequence on one page of the latest UK charts to 5 days ahead, see either -
- All latest UK forecast charts in full size. (Page is about 790KB in total)
or
- All latest UK forecast charts in reduced size. (Page is about 290KB in total)
These charts are also available in colour from
- The Met Office synoptic chart page - For 00 an 12 UTC.
Other links are from �
- The UK Weather Information site - This is good for charts from many weather services.
HIRLAM
High Resolution Limited Area Model forecasts]] for two days ahead are available from theKNMI, the Dutch Weather Service.
HIRLAM countries and as below. Home pages are on the External Links page
Computer Charts - Unmodified
A note on these is on the Essential page. They are output direct from Numericl Weather Prediction models. They can be quite difficult to interpret and should be used with care. As is the case with GRIB forecasts, there has been no vetting or quality control.
ECMWF
Charts from ECMWF for the next 10 days. There is the facility to look back and see what the model was producing on previous days and times.
To these can be added GRIB charts.
Oceanic Charts, some with plotted observations
For notes se theEssential page.
For swell forecast charts for the Atlantic and UK, se the The National Centre for Ocean Forecasting (NCOF) site.
Other Sources of Links to Weather Charts
- A MailASail service for getting charts by email in small files.
- Comprehensive set of charts.
- Georg Mueller's comprehensive site, too many to list here.
- Archive of Met Office synoptic charts.
- US NWS RadioFax charts