
Some revision in June 2023.
About this page
A brief summary of the data and data sources used in NWP (Numerical Weather Prediction) with some indication of impacts.
Related pages
On this page -
- The need for data
- Terrestrial based observing systems
- Space based observing systems
- Data volumes
- Using the data
Data types
Like medicine, a weather prognosis needs a diagnosis based on observation. As in medicine, some data are direct measurements and some are inferred. In the case of weather this involves a complex system of measurements of the atmosphere from terrestrial and space-based systems. Since the early 1950s, technology has advanced greatly in computing and instrument design. In situ and remotely sensed technologies have improved beyond recognition. This has led to a vast increase in the amount of data used in NWP models.
Data types are :
- Measured in situ.
- “Conventional” observations from land stations, ships, moored buoys usually at fixed “synoptic hours.”
- Drifting buoys monitored from satellites on a catch as catch can basis.
- Radio-sonde balloons launched at fixed times, synoptic hours, virtually all from locations over land, a few from ships on passage.
- Aircraft in flight and ascent/descent flight segments on an opportunity basis.
- Measured at specific locations from space:
- Scatteromrter measurements of surface winds,over the sea Arctic to Antarctic.
- AMVs, Air Motion Vectors. Movement of cloud, visual and infrared, and water vapour images at high (cirrus) levels. Globally.
- Indirect, areal measurements.
- Infrared soundings over the sea. Measurements of absorption of IR due to different air temperatures and water content.
- Microwave emissions due to varying temperatures, water drops. Globally.
- GNSS (GPS) Radio Occultation. Air density profiles.
These do not provide data from which temperature or humidity data can be derived.
Terrestrial based observing
At the surface
Weather observations have for many years been made from networks of stations over land and from ships on passage. Increasingly, observing systems have been automated and, in addition to pressure and temperature, objective measurements can be made of visibility, cloud base and amount. Even “weather” can be automated.
Over the land, gaps in networks can be filled by totally automated systems. Tethered and drifting data buoys are used over the oceans and seas to provide data in otherwise badly covered areas.
ECMWF routinely producesdiagrams of data used in its predictions. The first example shows locations of weather reports from land and ships at sea. "SYNOPS" refers to reports from land stations; "METARS" are abbreviated reports from airfields and "SHIPS" are reports from ships on passage.
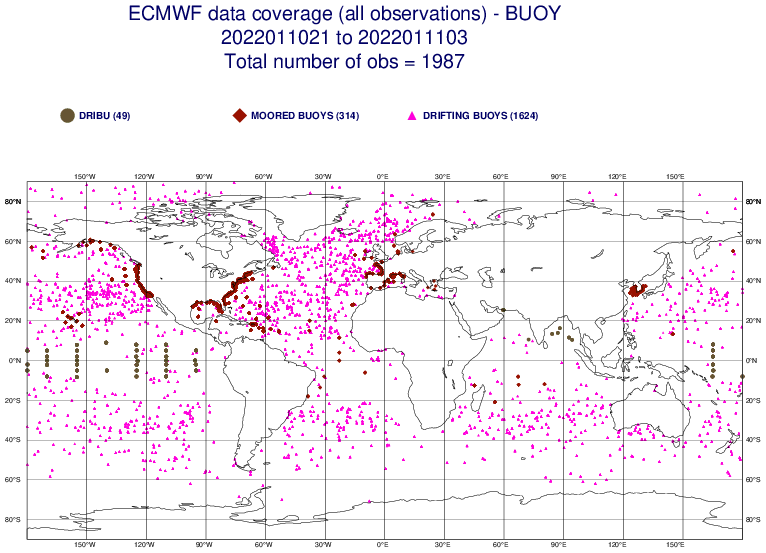
The next diagram shows the coverage of data buoys. Drifting buoys only measure pressure and sea temperature and are deployed by ships on passage to fill gape in ship reports.
Above the surface
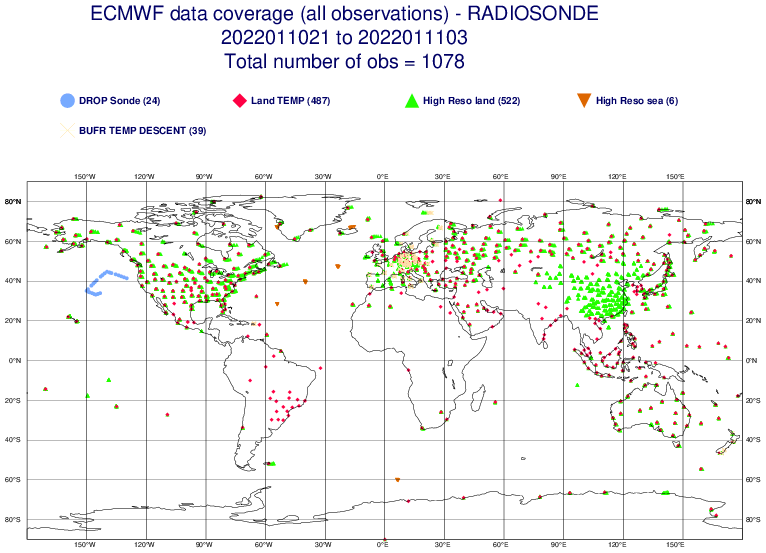
The conventional method of measuring wind, temperature and humidity above ground level is the Radio-sonde. This is a cheap, use once, system that telemeters data back to the ground station. Winds used to measure using radar tracking but are now more often by using GPS.
There are some 600+ stations worldwide as shown here as “Temp.”
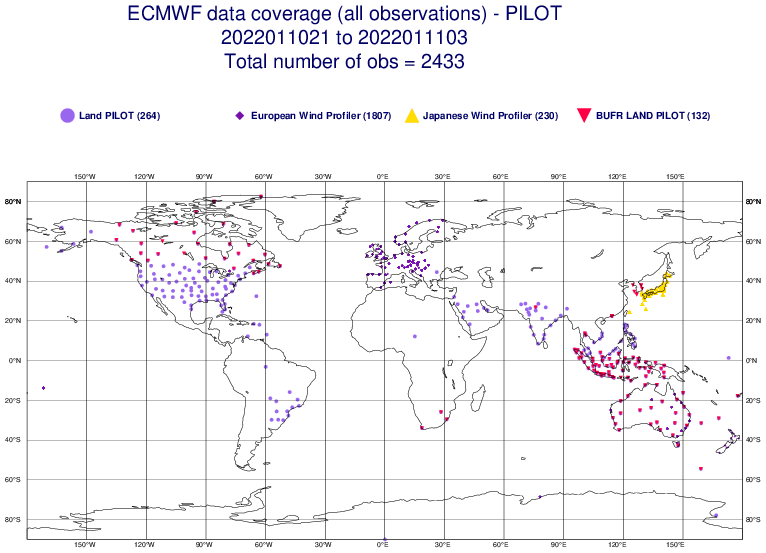
These ascents are made, usually, twice a day. At some locations, at intermediate hours, wind only ascents are made; Pilots. There are a few “Profilers” in use. These are vertically looking radars that can “see” clear air moving. The next diagram shows locations of Pilot and Profiler measurements.
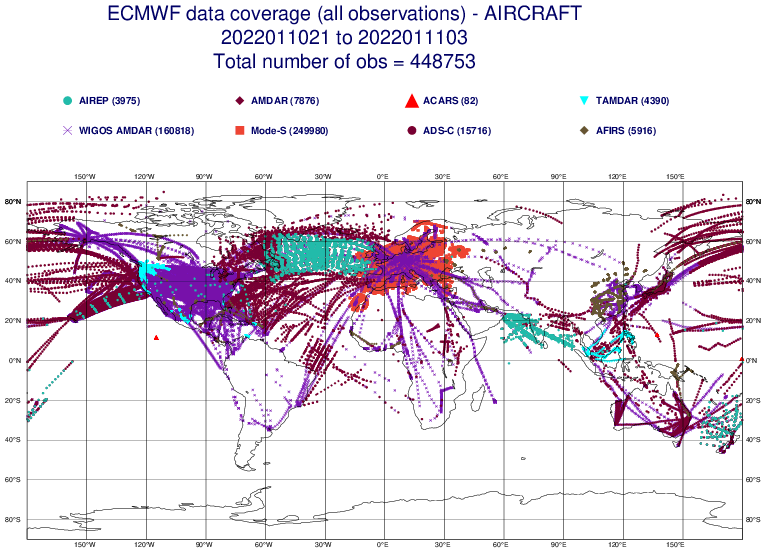
In addition to these, measurements are also obtained automatically from aircraft en route and on the ascent/descent phases.
Space based systems
Sensors and orbits
There are two types of each. Sensors can be passive or active. Passive sensors “look” at the earth and atmosphere using visible, infrared and microwave frequencies. Active sensors transmit a signal and receive the return, radar is an example.
Orbits can be GEOD (Geostationary )t around 35,000 km or LEOs (Low Earth Orbiter), usually near polar, at heights of 400 – 800 km. The latter can make finer resolution measurements than Geostationary satellites. The latter are good for looking at cloud or water vapour and measuring movements to deduce winds at cloud levels.
Active sensors
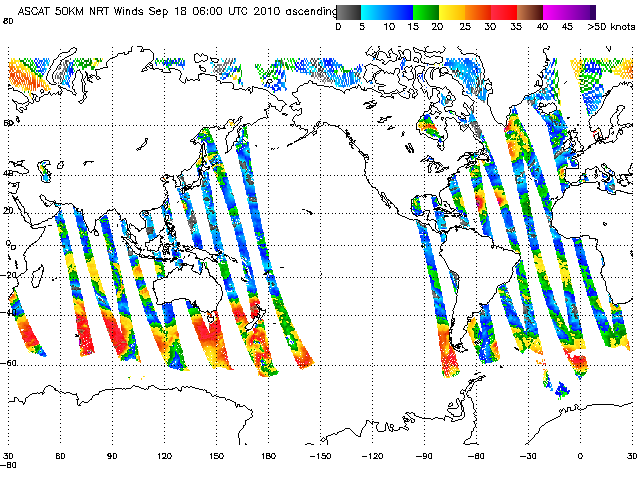
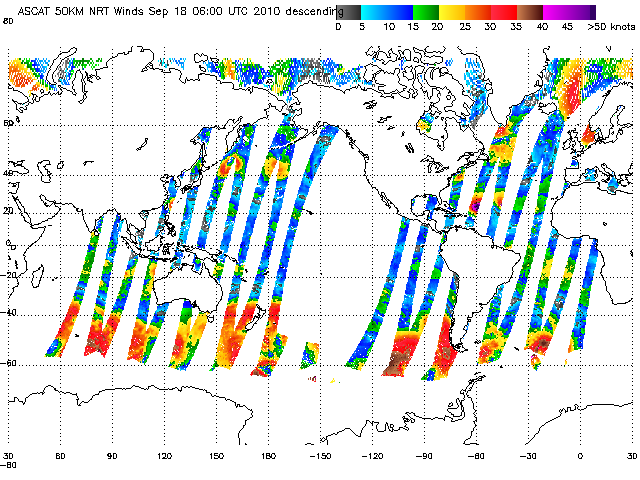
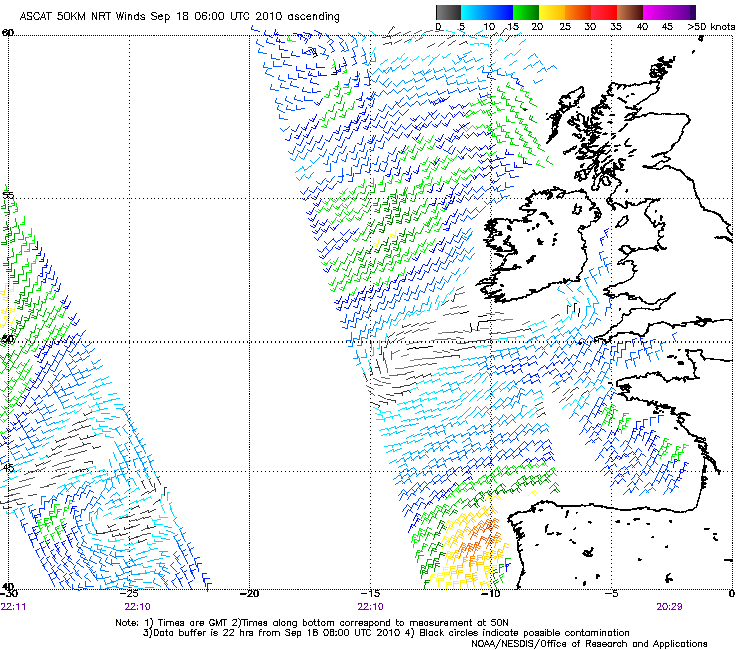
Winds at sea level are obtained from LEOs by measuring the scattering of a radar beam using a “Scatterometer.” These are high quality data with spatial resolutions between 25 and 50 km. Measurements are in swathes as shown here.
Passive sensors from GEOS
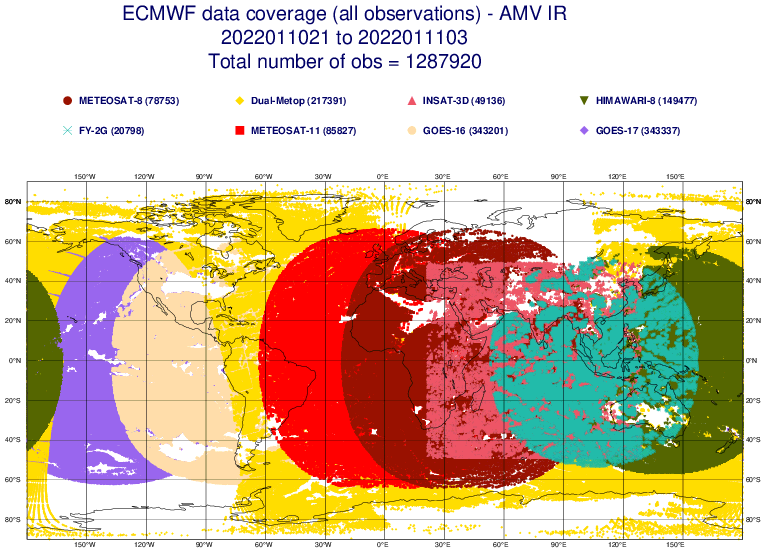
High level winds are obtained using visible and infra-red light to measure cloud movement. Infrared can also see and measure movement water vapour in otherwise clear air. These are AMVs (Air Motion Vectors.) This is an example of the area and numbers of observations of winds mainly measured from a geostationary satellite. Over polar regions data are from LEOs.
Passive sensors from low earth orbit
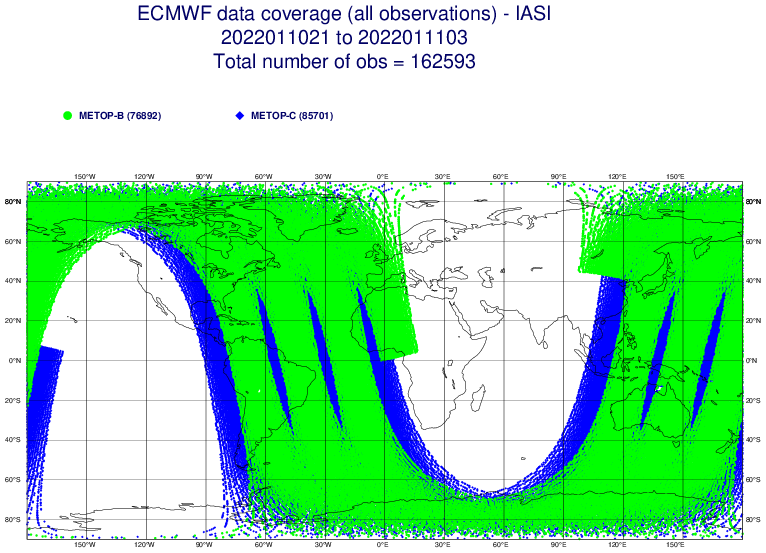
LEOs provide most of the temperature and humidity data using passive sensors. Infrared light is used to measure absorption of heat emitted by the earth. Absorption (the greenhouse effect) depends on temperature and water vapour. There are four systems currently in operation HIRS (High resolution Infrared Radiation Sounder), AIRS (Advanced Infrared Radiation Sounder), CRIS (Cross Track Infrared Sounder) and IASI (Infrared Atmospheric Sounding Interferometer). IASI is the most sophisticated having a vertical resolution of about 1 km in the lower troposphere and 15 km horizontally. Each IASI sounding provides about 90 bits of data.
This shows IASI coverage.
 .
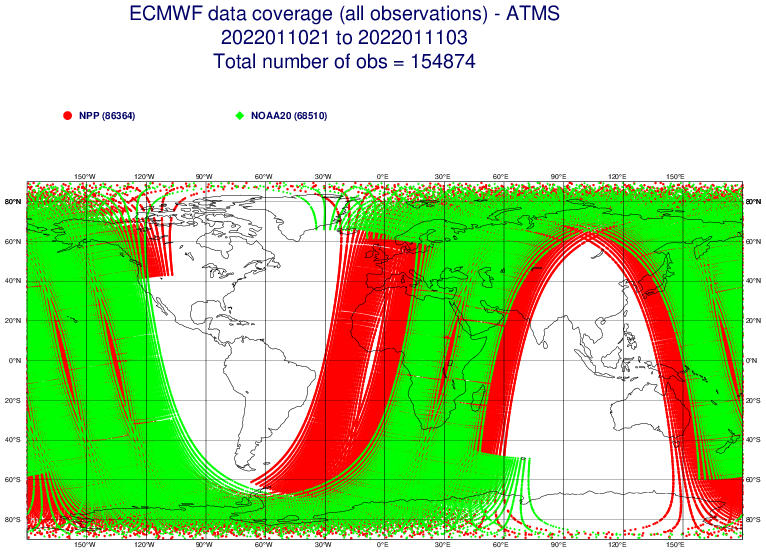
.There are three passive micro-wave sounders in operation, MHS (Microwave Humidity Sounders), AMSU-A (Advanced Microwave Sounding Unit) measuring temperature and ATMS (Advanced Technology Microwave Sounder). The last combines the technology of the other two and is high resolution. Each sounding provides 22 bits of data. This shows ATMS coverage.
Microwave and infrared sounders have been under development since the mid-1970s. Improvements have been major factors in the improvement of NWP.
GNSSRO
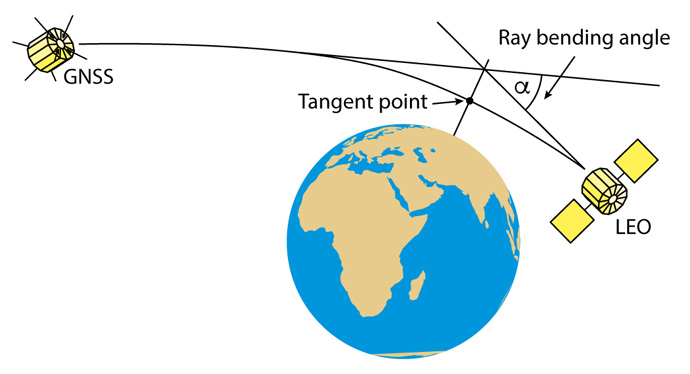
This is a relatively new (operational since 2006) technique using the occultation of radio signals from GNSS satellites (Global Navigation Satellite Systems). Refraction (bending up to about 1°) of radio signals by the atmosphere is related to the density profile of the atmosphere, itself dependent on temperature and water vapour content. The amount of bending of the signal is obtained by measuring the phase shift. In the stratosphere with its low water content, GNSSRO gives a good indication of temperature profiles. In the troposphere it is impossible to separate the effect of water vapour from temperature. In the lowest layers, water vapour dominates; in the mid troposphere effects of tempersture and water vapour can be similar.
It follows that claims that GNSSRO provides data similar to radio-sonde ascents are incorrect. Those making such claims are being deliberately misleading.
Reception is by LEOs. Because several measurements are taken in quick succession, detailed profiles can be observed. Information is particularly good in the upper troposphere/lower stratosphere but not reliable in the lower troposphere. A major strength is the lack of bias in the data which provide a good “anchor” at high levels thus improving utilisation of much other satellite data.
This is a schematic of the process.
 .
.Acknowledgements to ECMWF
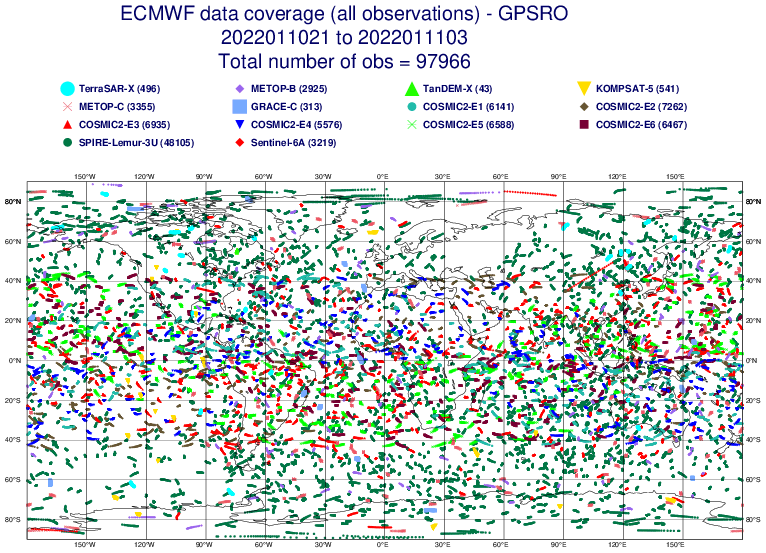
At time of writing, all the data used were from meteorological satellites. From February 2022, increasing use will be made of data from Spire Global which has launched many Cubesats. These data are of comparable quality to “official” satellite GNSSRO data. An example of the data coverage is shown here.
 .
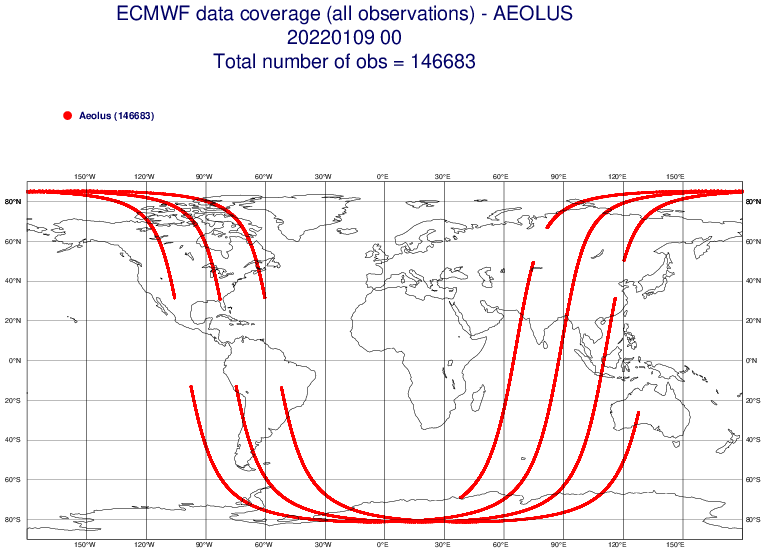
.Aeolus
This is an active microwave instrument currently being trialled. This fires a lidar beam at the atmosphere and uses Doppler techniques to measure wind right through the atmosphere, the first of its kind. This shows the coverage.
 .
.Data Volumes and impacts
The table will give some idea of the scale of the data handling involved. The values given here are from the ECMWF data coverage pages. These give typical numbers of in situ and remotely sensed measurements and soundings received by ECMWF over a 12-hour period. It is possible to toggle between data volumes and numbers actually used. “Impacts” are estimates of the relative % impact of each data type on the 24-hour forecast.
Terrestrial based | |||
Observing system |
Data volume |
Impacts | |
|
Surface synoptic and ships |
195,000 |
9 | |
|
Data buoys, drifting and moored |
1990 | ||
|
Aircraft |
500,000 to 1.5M |
7 | |
|
Radio sonde |
1000 |
6 | |
|
Balloon winds and profilers |
3,000 |
1.5 | |
Space based | |||
|
Cloud motion winds (AMVs) |
62.5M |
11 | |
|
Scatterometer |
500,000 |
3 | |
|
Microwave-passive & Aeolus |
1.2M |
23.5 | |
|
Infra-red |
340,000 |
25 | |
|
GNSSRO |
115,000 |
7.5 | |
Data source: ECMWF Data Coverage pages.
From what has been written earlier, it is clear that even the large amount of terrestrial based (in situ) observations are far from sufficient to describe the atmosphere adequately. The table shows the importance of space-based data. There are some other forms of data not listed here still being developed.
As an empire rule, increasing the data volume of a specific type will result in an impact roughly proportional to the logarithm of the volume increase. So, increasing the volume of GNSSRO data by 100%, as would be the case if all Spire data were included, would result in the impact of RO data increasing to 12%.
An "observation" can be many bits of data. A radio-sonde ascent will have values of wind, temperature and humidity at many levels; satellite "soundings" can consist of radiances at several wavelengths. At a conservative estimate, the number of pieces of data available for use in a numerical weather prediction data analysis is probably over 30 million.
Using the data
There are major problems in handling data in NWP.
- Dara volumes over all are massive.
- The data have widely different characteristics in terms of -
- Resolution in the areas where each type is available.
- Geographical distribution.
- Accuracy.
- Whether they are direct measurements of meteorological variables or
- The effects of the various meteorological variables on the atmosphere.
- Data volume are such that not allcan be used effectively.
- Data from LEO satellites are made at continuously varying times.
Data analysis has to be done on a 4-dimensional basis using some form of mathematically optimal fitting. There is no definitive “correct” answer. It is not surprising that roughly as much compute power as the NWP itself.
Home
----